This report examines the potential impact of a carbon levy on the African shipping industry, highlighting the economic challenges and opportunities it presents while advocating for equitable redistribution of revenues to support an inclusive transition to net zero emissions.
As the world grapples with the realities of climate change, the shipping industry has come into sharp focus as a catalyst for global climate action. The International Maritime Organization (IMO), the entity responsible for regulating international shipping, has committed to cutting emissions from shipping to net zero by around 2050. Along the way, the organisation aims to reduce total annual greenhouse gas (GHG) emissions from international shipping by at least 20%, striving for 30%, by 2030 (compared to 2008’s emissions); and by at least 70%, striving for 80%, by 2040. The 2023 IMO GHG Strategy emphasises the complementarity and importance of a goal-based GHG fuel intensity standard and a maritime GHG emissions pricing mechanism. The IMO’s Marine Environmental Protection Committee (MEPC) is therefore working within this framework to select the appropriate measures it needs to achieve net zero emissions.
While some countries view the decarbonisation of the shipping industry as a chance to industrialise, for example by developing industry to supply green hydrogen as a maritime fuel, many states, including those with high ambitions, are concerned about the increasing cost of living and food security. It is against this backdrop that this report looks at some of the candidate mid-term measures under discussion at the IMO and the likely impacts they will have on African economies. The report also explores which issues need to be addressed for especially developing countries if the implementation of the measures is to be supported, as well as what opportunities there might be to trade off costs against benefits if the planned economic measures materialise.
To assess the potential impact of a shipping tax on the economy and food security in African countries, we used the Global Trade Analysis Project Energy-Environmental (GTAP-E) Computable General Equilibrium (CGE) model calibrated on the GTAP 11 database. The analysis examined the impacts of the tax on both the African economy as an aggregate and selected individual African economies. We found that the imposition of a levy on carbon would reduce the supply of maritime shipping services among African countries by up to 7%. We also found that in most individual African countries, the levy would have negative but limited effects on GDP, with a forecast reduction in GDP of 0.121% in the case of Equatorial Guinea, which would be the worst affected. The results also show that the global prices of agriculture and processed food commodities would increase by 0.011% and 0.013% respectively, with implications for food security, especially since African countries import a large proportion of food items. Household incomes would fall in most individual African countries. Ghana, for example, is forecast to experience a 0.101% reduction, 10 times the reduction forecast for European household incomes. In general, the results show that a shipping levy is expected to reduce international trade, increase cost of shipping, increase prices of commodities and marginally reduce GDP and household incomes across the continent.
As a case study, our team interviewed key players in Ghana’s maritime sector ecosystem to discover what the key considerations are for stakeholders in reaching consensus around the mid-term candidate measures. These engagements revealed significant hesitation towards the introduction of a shipping levy due to the increased cost of doing business that would arise from the imposition of GHG measures. The disproportionately negative impacts that the GHG reduction measures would have on the economy of Ghana and the majority of African countries is expected to exacerbate existing structural imbalances in freight costs. Fears were also expressed at the likelihood of Ghana’s limited fleet becoming too costly to operate and rendered obsolete if stringent GHG reduction measures are implemented. Hence there is a call for transition fuels to be permissible in the mid-term. Lastly there was strong opposition to the idea that revenues generated from the economic measures would be limited to use by the shipping sector only.
Our report concludes by recommending that the IMO adopts GHG reduction measures which allow for the redistribution of a significant portion of the revenues raised towards funding out-of-sector mitigation and resilience. These funds can be used to develop projects in renewable energy, resilient agriculture and hydrogen production, all of which will contribute to the achievement of an equitable transition to net zero emissions. These redistributions will help to smooth out the effects of the higher costs of doing business. Redistribution should be carried out with due regard to each country’s specific circumstances. Key criteria for determining the revenues a country should receive include exposure to climate risk, economic context, access to climate finance and fiscal space, national income, the magnitude of disproportionate negative impacts that the measures have on the economy as well as the country’s own contribution to GHG emissions. Finally, and perhaps most importantly, redistributions to countries should be in the form of direct transfers, not loans, if they are to truly reflect the principle of ‘polluter pays’.
According to the Review of Maritime Transport 2023 (UN Trade and Development, 2023), more than 80% of global trade in 2023 was carried by ships. These ships carry everything from consumer goods, manganese, vehicles, agricultural produce, fuels, etc. across the globe. International shipping has traditionally used fossil fuels, mainly diesel and heavy fuel oil, generating greenhouse gas (GHG) emissions such as sulphur and carbon. According to the International Energy Agency (IEA), shipping contributes some 3% of global GHG emissions.1 As the world grapples with the realities of climate change, shipping has come into sharp focus, especially as the emissions generated by the industry are increasing by as much as 5% year on year.2
Source: International Energy Agency, 2023
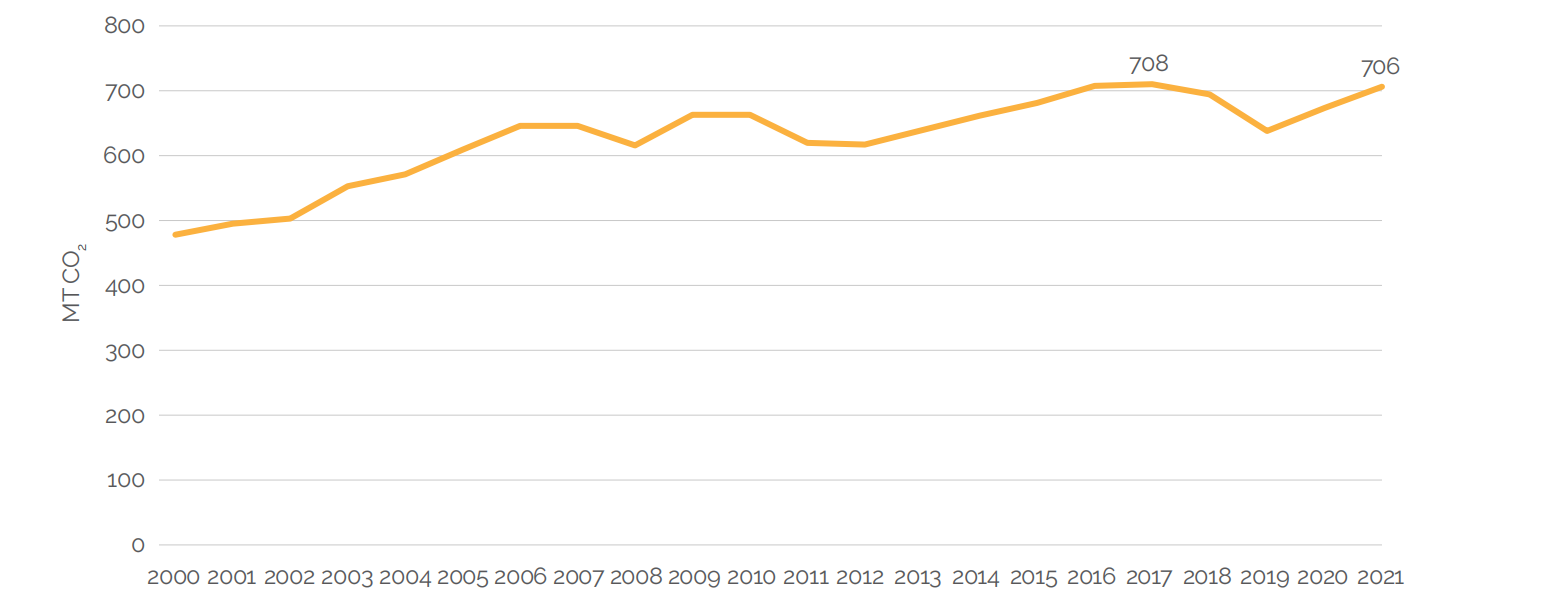
Using the vessel-based allocation of international shipping taken from the Third IMO GHG Study, the Fourth IMO GHG Study has also concluded that CO2 emissions from shipping increased over the period 2012-2018 from 848 megatonnes (Mt) to 919 Mt, an 8.4% increase.3 These rates of growth are in stark contrast to the average 2% year-on-year reduction in GHG emissions that must be achieved to reach the target of 605 Mt CO2 annual emissions by 2030.4
Tackling the industry’s emissions is thus seen as a means for making a meaningful impact on global decarbonisation. In 2018, the International Maritime Organization (IMO), through the Marine Environment Protection Committee (MEPC), adopted the Initial IMO Strategy for the reduction of GHG emissions. In addition to the implementation of a cap on sulphur emissions permitted by ships, the strategy also considers the use of market-based measures (MBMs) to limit GHG emissions.
Subsequent MEPC meetings, specifically 2019’s MEPC 73 and MEPC 74, failed to define or reach consensus on the market-based measures necessary to galvanise the shipping industry into decarbonising. In 2019, the slow pace of progress at the IMO led the European Union (EU) to set its own course for maritime decarbonisation in the EU under the European Green Deal Framework. This framework sets out clear pathways for reducing GHG emissions by 55% by 2030 and making the EU climate neutral by 2050.5 The maritime industry was to contribute to this GHG reduction agenda via two key initiatives: firstly, including the shipping industry under the existing European Union Emissions Trading System (EU-ETS), and secondly, adopting the FuelEU Maritime regulation to check the GHG intensity of fuels used by the industry.
While the EU embarked on these unilateral initiatives, the IMO continued to receive proposals and to work on improving candidate measures with a view to reaching consensus amongst its 176 member states. In 2023, the IMO adopted the Strategy on Reduction of GHG Emissions from Ships (the 2023 IMO GHG Strategy) with the aim of urgently phasing out GHG emissions from international shipping while promoting a just and equitable transition to net zero. The strategy also emphasised the importance of mid-term measures consisting of an economic element in the form of a levy/tax/carbon price mechanism aimed at putting a price on carbon to discourage emissions, and a technical/fuel standard aimed at pushing the industry towards the use of greener fuels and technologies.
As negotiations continue to define the scope and content of the two measures, several IMO member states, especially the developing countries, have pushed for a consideration of the impact of the measures, including the high costs of compliance, and have argued for an equitable decarbonisation of the maritime sector, as is the case in the general transition to net zero. The principles of ‘equity’ and ‘common but differentiated responsibilities and respective capacities’ are essential elements of the Paris Agreement.6 In fact, the IMO states that in the development of candidate mid- and long-term GHG reduction measures, ‘due account should be taken to ensure a just and equitable transition that leaves no country behind’.7 An equitable transition implies that the peculiarities of different stakeholders are recognised and reflected in any mechanism that is chosen so that the mechanism can be widely adopted by a wide range of geographically and economically diverse member states.
Depending on which African countries one speaks to, the decarbonisation of the maritime sector is viewed as an opportunity or a threat. While some countries see it as a chance to develop an industry around green hydrogen as a maritime fuel, many states, including those with high ambitions, have concerns around the increasing cost of living and food security. It is against this backdrop that this report seeks to delve into the candidate measures currently under discussion at the IMO, the likely impacts these measures will have on African economies and the issues that need to be addressed for especially developing countries if their implementation of the measures is to be supported. The study will also investigate what opportunities there might be to trade off costs against benefits if the planned economic measures materialise.
The report provides a detailed quantitative and qualitative analysis of the potential impacts of the key candidate economic measures on African countries, using the example of the Ghanaian economy. It ascertains whether any opportunities exist to trade off costs against benefits so that the Ghanaian maritime sector’s drive towards decarbonisation can be equitable. To this end, the report seeks to answer the following questions:
To answer these questions, we designed a quantitative model to assess the potential economic and food-security-related impact of a shipping tax on African countries. In addition, our team interviewed key players in Ghana’s maritime sector ecosystem.
Through its Fit for 55 Package and the Green Deal Framework, the EU is so far the only region that has introduced policy measures affecting shipping. Its agenda for greening the maritime sector is being implemented via the European Union Emissions Trading System and the FuelEU Maritime Regulation, both of which are discussed below:
Established in 2005, the European Union Emissions Trading Scheme (EU-ETS) is the world's first and largest carbon market, and a cornerstone of the EU’s policy to reduce GHG emissions and combat climate change. The EU-ETS is a cap-and-trade system in which the amount of carbon that is allowed to be emitted in a given period is capped. This cap is translated into emissions permits known as European Union Allowances (EUAs). Each EUA allows the holder to emit one metric tonne (t) of carbon into the atmosphere. At the end of the relevant period, companies are required to surrender or return allowances equal to their emissions, failing which severe financial penalties are imposed. The price of one EUA is therefore equivalent to the price of carbon to be paid by the eligible entity. This is currently around EUR 75 per t of CO2.8
The shipping industry was brought under the EU-ETS on January 1, 2024, in order to ‘incentivise energy efficiency, low-carbon solutions and reductions of the price difference between alternative fuels and traditional maritime fuels’.9 By imposing this carbon tax on shipping, the EU aims to incentivise both shipping companies to internalise the cost of their pollution and the industry to reduce GHG emissions in maritime transport.
The EU-ETS for shipping requires shipowners to surrender allowances for every tonne of carbon emitted above the permitted level as they sail to/from an EU port. The quantity of carbon emitted is calculated by multiplying the fuel’s carbon emission factor by the number of tonnes burned. For example, if a ship burns 5,000 t of heavy fuel oil sailing between two ports, the total CO2 emitted will be equal to 5,000 multiplied by 3.114, which is 15,570 t of CO2 (tCO2). Having determined the quantity of CO2 emitted, the shipowner then buys carbon credits at the current carbon price to offset its emissions, paying a total of the carbon price multiplied by the quantity of carbon credits required. In the earlier illustration, the total cost to be paid by the shipowner for the emissions would be 15,570 tCO2 x EUR 75 = EUR 1,167,750.00. It is important to note that the EU-ETS for shipping is being implemented in phases, with shipowners being required to surrender allowances for only 40% of the cost of emissions generated in 2024. This will increase to 70% in 2025 and 100% from 2026 onwards. In addition, for sailings between an EU port and a non-EU port, allowances are required for only 50% of the emissions. For example, if the sailing was between Rotterdam (an EU port) and Tema (a non-EU port), the carbon tax payable using a price of EUR 75 per EUA would be 0.4 x 0.5 x 15,570 tCO2 x EUR 75 = EUR 233,550.
Since 2013, the EU-ETS has raised an estimated USD 152 billion. It is expected to generate some USD 40 billion in revenue from the inclusion of the maritime sector in the ETS.10 The legislation, which provides the legal framework on the use of the resources, requires revenues raised from the maritime sector to be channelled through the EU Innovation Fund to support the acceleration of the decarbonisation of the maritime sector in the EU. According to the commission, an estimated EUR 1.6 billion (20 million EUAs at an average price of EUR 80) is expected to be used in the period up to 2030 to support the development of innovative solutions including the production and uptake of renewable and low-carbon fuels as alternative fuels for shipping.11 12
FuelEU Maritime is a regulation adopted by the EU in July 2023. Designed to decarbonise maritime transport, its three main goals are reducing the GHG intensity of the energy used on board ships, increasing the use of onshore power supplies (OPS) in major European ports and incentivising the uptake of renewable and sustainable fuels. The regulation prescribes zero-emission requirements for ships at berth in EU ports. This means that ships in port will need to use zero-emission power alternatives such as onshore electricity.
In addition, the regulation sets maximum limits on the annual average GHG intensity of the energy used by ships above 5,000 gross tonnage and which call at European ports, irrespective of their flag. These limits will be set with a view to reducing the GHG intensity of fuels used in the sector over time, starting with a 2% decrease by 2025 and reaching up to an 80% reduction by 2050 (European Commission, 2024). In this way, the EU aims to stimulate an increase in the uptake and production of renewable and low-carbon fuels whose GHG intensity is lower. FuelEU Maritime will target CO2, methane and nitrous oxide emissions, while considering the full lifecycle of the fuels used onboard on a Well-to-Wake (WtW) basis. The regulation is set to come into effect on January 1, 2025.
The IMO has committed to cutting emissions from shipping to net zero by 2050. Along the way, the organisation aims to reduce total annual GHG emissions from international shipping by at least 20%, striving for 30%, by 2030 (compared to 2008’s emissions); and by at least 70%, striving for 80%, by 2040. The 2023 IMO GHG Strategy emphasises the complementarity and importance of a goal-based GHG fuel intensity standard and a maritime GHG emissions pricing mechanism. The Marine Environment Protection Committee (MEPC) is therefore working within this framework to select the appropriate measures to achieve net zero emissions.
Since the strategy was adopted at MEPC 80, several proposals have been tabled before the IMO to achieve the targets. As of the end of MEPC 81, the candidate measures with the most traction include:
The 6PAC+ Proposal is championed by Belize, Fiji, Kiribati, the Marshall Islands, Nauru, the Solomon Islands, Tonga, Tuvalu and Vanuatu, some of the most climate-vulnerable island states. The co-sponsors, nicknamed 6PAC+, propose a high levy on emissions in combination with a simplified fuel standard of increasing stringency. The proposed levy – the Universal Mandatory GHG Levy (GHGL) – is a flat rate that will be applied to lifecycle emissions. 6PAC+ also propose the highest carbon price of all the candidate measures, beginning at USD 150 per t of CO2 equivalent, and increasing every five years. Studies show that this could generate up to USD 3.7 trillion by 2050, which translates to USD 40-60 billion annually.13
This proposal has two key features. First, it excludes any flexibility mechanism.14 Second, it ensures that a significant portion of the revenues generated are distributed in line with an agreed strategy, with as much as 51% of the revenues allocated to climate resilience projects in small island developing states (SIDS), 33% to research and development for international maritime fund research projects and the remaining 16% to administrative costs.15 In line with the equitable transition goals of the co-sponsors, the proposed allocation of funds places a significant weight on out-of-sector uses.16 This also ensures that the polluters (shipowners) pay for the cost of climate mitigation of which SIDS and least developed countries (LDCs) have to bear the brunt as a result of being on the frontline of the adverse impacts of climate change.
The International Maritime Sustainability Fuels and Fund (IMSF&F) is a technical proposal sponsored by Argentina, Brazil, China, South Africa, Norway, Uruguay and the UAE. This proposal consists of an economic and a technical element. The sponsor group, which has a strong BRICS17 leaning, proposes a tank-to-wake (TtW) GHG fuel intensity (GFI) limit in combination with a flexibility mechanism that allows for revenue generation.
The technical element of this proposal works by setting a TtW limit on the GHG intensity of fuels used by ships (a required GFI), against which ships will measure their attained annual GHG fuel intensity (attained annual GFI). As with the EU’s FuelEU Maritime, if the attained annual GFI is lower than the required GFI, the ship is considered to have outperformed the target and is entitled to Surplus Units (SUs). A ship which fails to meet the target is considered under-compliant and will incur Deficit Units (DUs).
Although the measure is applied on a TtW basis, it takes into account the broader well-to-wake (WtW) GHG emissions of marine fuels by applying different categorisations on fuels, ranging from sustainable to unsustainable.18 A ship’s attained GFI will vary with the fuel it uses: Ships using unsustainable fuels cannot earn SUs. The proposal also contains the option for an exemption: Ships serving ports in certain developing countries will be allowed ‘to apply a correction factor to their GFI, making it easier to comply’.19
Ships with SUs may claim them from the Sustainable Shipping Fund while those with DUs may purchase Remedial Units (RUs) from the fund at a price determined by the committee. This would be set at a level that bridges the cost gap between compliant and non-compliant ships.20 The sponsors expect that the bulk of the revenue will come from the sale of RUs but that voluntary contributions/donations will also flow into the fund. Only after the satisfaction of reward claims for SUs have been fulfilled can any remaining funds be used to tackle research and development, capacity building, etc.
This proposal does not contain a levy and therefore is predicted by developing countries to have only a limited negative impact on their economies. It also allows for grey fuels to be utilised until they are progressively phased out, such that the existing, ageing fleets of these developing countries can remain operational in the mid-term.
The GHG Fuel Standard (GFS) is another technical standard with an in-built economic element. The standard is sponsored by Austria, Belgium, Bulgaria, Croatia, Cyprus, Czechia, Denmark, Estonia, Finland, France, Germany, Greece, Hungary, Ireland, Italy, Latvia, Lithuania, Luxembourg, Malta, the Netherlands, Poland, Portugal, Romania, Slovakia, Slovenia, Spain, Sweden and the European Commission.
This proposal is based on a WtW approach and aims at reducing the GHG intensity of fuels utilised by the maritime sector. It works by setting a GHG Fuel Intensity standard (required GFI) which will be progressively reduced over time in line with the IMO’s targets and checkpoints in its 2023 Strategy. Ships that sail on fossil fuels with more than the required GFI will be required to hand in Flexible Compliance Units (FCUs) or Greenhouse Gas Remedial Units (GRUs) to comply. By setting the price of FCUs as a function of the marginal abatement costs of clean green fuels, the GFS bridges the price gap between conventional fuels and fuels with the required GFI. Ships that out-perform the required GFI receive FCUs whose value they can realise, thus bridging the price gap between conventional and green fuels.
The key aspect of this proposal is that the lifecycle emissions of the fuel are considered, thus removing any risk of increasing emissions, unlike the IMSF&F which allows a spectrum of fuels including LNG.
It is clear from the design of this proposal, and from the list of sponsors behind it, that it shares many similarities with FuelEU Maritime, likewise aiming to stimulate a convergence of global standards with the EU’s legislation. The sponsors have also indicated that if the IMO adopts the FCM, thus making FuelEU Maritime redundant due to regulatory convergence with the IMO, provisions in the FuelEU Maritime regulation will need to be reviewed (and perhaps dropped).21
Sponsored by the World Shipping Council, the Green Balance Mechanism (GBM) seeks to achieve a reduction in GHG intensity by rewarding shipowners whose fleets perform better than a defined GHG intensity threshold. These rewards will be in the form of payments out of a Green Balance Fund, which will be funded by shipowners whose fleets perform below the same threshold. It is a feebate/reward mechanism that aims to be more targeted, graduated and financially efficient than conventional levies by distributing the additional cost of low-emission fuels and technologies used in the sector such that the effective cost to all ships is roughly equal.22
The notable elements of this measure are the Green Balance Mechanism GHG Fuel Intensity (GBM GFI), a threshold against which a fleet’s annual and independently verified WtW GFI (attained GFI) is measured. If the attained GFI is superior, the shipowner is entitled to receive payments, called Green Balance Allocations, from the Green Balance Fund. Should the vessel or fleet be unable to achieve the GBM GFI, the shipowner will pay Green Balance Fees to the Green Balance Fund.
The GBM system of implementing fees and allocations has been designed along the lines of a Marginal Abatement Cost (MAC) policy. Due to its nature, the Green Balance Fund is not expected to build up excess funds from one year to the next as the funds collected each year in the form of Green Balance Fees will be distributed to shipowners through the payment of Green Balance Allocations. This is because the World Shipping Council, which is made up of shipping lines, is focused on closing the gap between conventional fuels and low-emission fuels for the industry. It also aspires to achieve the 2030 target of at least 5% of the energy used by international shipping to be from zero and near-zero GHG emitting technologies, fuels and/or energy sources. However, the council does propose that the GBM can be used in concert with or integrated into other measures to allow for out-of-sector disbursements towards research and development and climate mitigation.
The Fund and Reward (Feebate) mechanism is proposed by the International Chamber of Shipping (ICS), the Commonwealth of the Bahamas and the Republic of Liberia. The proposed mechanism will be used to fund a Zero Emission Shipping Fund (ZESF) to accelerate the transition to net zero by 2050 and incentivise the production and uptake of zero GHG marine fuels while providing billions of US dollars to support the transition in developing countries.
The sponsors propose that ships pay a mandatory flat rate to the ZESF for each t of CO2 they emit; ships that use clean fuels will be rewarded via a payment of the flat rate for every t of carbon emissions avoided. It is proposed that the ZESF be managed by the IMO – the regulator of the global maritime industry.
The ICS estimates it will cost USD 5-10 billion per year to reduce the cost gap between conventional fuels and alternative fuels and reach the IMO’s target of 5-10% of the energy used by shipping to come from zero/near-zero GHG sources by 2030. It also commissioned an impact assessment which shows that the mandatory contribution rate – if set at between USD 20-300 per t of fuel oil consumed – would have minimal impact on the cost of freight for shippers.23 However, it concludes that USD 20-40 per t of fuel oil consumed should be sufficient to generate the required USD 5-10 billion per year for the ZESF.
The architecture of the ZESF allows for the IMO to raise the actual contribution, if member states agree, and the extra to be paid into what it calls an IMO GHG Maritime Sustainability Fund (IMSF) which can be used to support an equitable transition in developing countries.
Article 37 of the IMO Convention establishes the MEPC as a committee that comprises all member states (the parties) of the IMO. According to the IMO, there are currently 176 member states: 40 from the African continent, 19 from the Latin American region and 22 from Asia.24
As of MEPC 81, several key issues remain under discussion, including whether to use WtW or TtW to calculate emissions; whether the ‘pricing regulation’ should be in the form of emissions trading, a carbon tax or both; and how revenues raised from the economic measures should be used. Nearly three quarters of the countries represented on the committee have agreed that the fuel standard should apply to emissions from burning fuel on ships, not to emissions from supply chains for that fuel, i.e. TtW was preferred to WtW. Furthermore, 22 out of 34 member states expressed their preference for the economic measure to take the form of a carbon tax. Most member states were opposed to a ‘pay to pollute’ option that allows ships to get out of fuel efficiency standards. Finally, 27 out of 37 member states wanted the revenues from a carbon tax to be applied in-sector only.25
In order for the GHG candidate measures to be adopted by the IMO – using an amendment to MARPOL Annex VI as the preferred pathway – broad consensus amongst states is required in accordance with Article 16(2)(f)(i).26 The threshold for consensus is as follows: An amendment to MARPOL Annex VI will be deemed to be accepted unless objected to in writing by not less than one third of the parties or by the parties the combined merchant fleets of which constitute not less than 50% of the gross tonnage of the world's merchant fleet. This means that the amendments to MARPOL Annex VI will be deemed accepted unless rejected. The member states’ active participation in deliberations is therefore key to ensuring that the outcome is reflective of the collective interest.
The goal of the modelling is to examine the economic and climate impacts of the IMO’s proposed shipping levy on African economies. We aim to analyse the impacts on the African economy as an aggregate and on selected individual African economies. We are particularly interested in the effects of the levy on Africa’s international trade, food security, GDP and prices. To do this, we use a Computable General Equilibrium (CGE) model – the Global Trade Analysis Project Energy-Environmental augmented version (GTAP-E) – which is commonly used for this type of analysis.
The GTAP-E model is an extension of the standard GTAP model, which provides a framework on how changes in policies (such as taxes and subsidies) affect the economic behaviour of firms and individuals in terms of the goods, services and factors of production that they demand and supply, as well as the interaction between countries, and how these reshape the global economy. GTAP does this by combining behavioural equations (which describe how firms and individuals respond to different prices in the economy) with market clearing conditions (i.e. that demand equals supply in each market of the economy – though it does allow the modeller to specify deviations from this condition). GTAP models how changes in demand and supply of goods in one market affect others by using ‘input-output accounting’, where the level of production in one industry determines the level of demand for specified inputs from others.
Other key assumptions include the following:
The GTAP-E model builds on the standard model by incorporating carbon emissions from fossil fuels and extends the production structure of the model. The production structure also includes energy in the capital bundle, assuming that energy is a critical input in the production process and is substitutable with other inputs. In other words, output is a combination of intermediate consumption of energy and value added, ‘value added’ being a combination of land, natural resources, labour and capital-energy bundle. The capital-energy bundle is disaggregated into capital and energy and, further down, to different forms of energy. Depending on the level of analysis of the study, the energy input can also be disaggregated into different forms using a constant elasticity of substitution (CES) function.
The GTAP-E model has been widely used to analyse energy and environmental policies. For further information on the model, please see McDougall and Golub (2007) and Corong et al. (2017).28
The GTAP-E model is calibrated on the GTAP 11 database. The database provides an overview of the global economy in 2004, 2007, 2011, 2014 and 2017, and includes bilateral trade flows, transportation and protection linkages and flows between domestic industries. The database also includes carbon emissions (CO2) from fossil fuels linked to each sector and region. The database includes a total of 160 countries/regions (including 141 individual countries and 19 aggregated regions), 65 sectors and eight primary production factors (land, capital, natural resources and five types of labour based on skill types).
For this study, we use data relating to 2017 and aggregate the 160 countries/regions into seventeen (17) countries/regions (EU, China, India, USA, UK, Egypt, Morocco, Ghana, Nigeria, DR Congo, Equatorial Guinea, Kenya, Ethiopia, Zambia, South Africa, Rest of Africa and Rest of the World).29 Similarly, the 65 sectors in the database are aggregated into 11 sectors (agriculture, processed foods, coal, crude oil, gas, oil products, electricity, water transport, energy intensive industries, other manufacturing industries and services). The inclusion of coal, oil, gas, oil products and electricity as individual disaggregated sectors is a requirement of the GTAP-E model. The water transportation sector in the GTAP database is a proxy for the shipping sector, as non-seaborne maritime activities appear to be marginal.30 The water transport sector is the focus of this analysis.
| Variable | Value |
|---|---|
| Number of regions | 17 |
| Data year | 2017 |
| Number of sectors | 11 |
| Total exports value in 2017 | USD 20.5 trillion |
The goal of the IMO is to reduce the emissions of the sector by imposing a ‘shipping levy’ akin to a carbon tax on the sector. We follow a simple approach to analyse the impact of the levy on the economy, viewing the water transport sector as any other activity in the GTAP database. The commodity of the sector is used in other sectors of the economy, such that an increase in the production cost or price of the commodity affects other sectors that use it.
To calculate the ad valorem equivalent of the shipping levy, we calculate the monetary value of the emission of the sector assuming a carbon price of USD 100 per metric tonne (t). This choice is partly informed by the IPCC’s 6th Assessment Report, which notes that a carbon price of USD 100 per t of CO2 can reduce global GHG emissions by at least 50% by 2030 relative to 2019 levels.31 Also, USD 100 per t had been discussed at IMO negotiations and is one of the values for the comprehensive impact assessment commissioned by the IMO on various options for greening international shipping.32
To calculate the monetary value of the emissions for the sector in each region, we multiply the emissions of the sector in t of CO2 equivalent in each region by USD 100. We then use the monetary value of the emissions of the water transport sector in each region as a proportion of the margin to calculate the ad valorem equivalent. This implies that the carbon tax is applied as a proportion of the monetary value of the emission on the water transport margin. We then use this ad valorem equivalent as the carbon tax shock in the model.
In our model, the tax/levy is imposed on individual countries’ shipping sectors and the revenue raised from the tax accrued to the country or region that levies it.33 34 We make this assumption because current discussions at the IMO do not clearly indicate where the shipping levy will be collected and how the resulting revenues will be used. The only point on revenue use of which most member states appear to be in favour is that revenues should be used within the shipping sector. It would therefore seem reasonable to assume that they will be used to help shipping fleets go green. The idea that countries will receive revenues in proportion to the amount of carbon tax that they pay would seem to be in line with this tendency.
United Nations Trade and Development (UNCTAD) and Det Norske Veritas (DNV) have also modelled various scenarios for the IMO’s approach to greening the shipping sector. UNCTAD analyses the global economic impacts, like ours, while DNV’s assessment focuses on the effects on the fleet.
DNV models the effects of regulatory measures to reduce emissions from ships, such as the fuel standard that governments are discussing, as well as feebates and/or carbon levies. They analyse how this will impact ships’ costs, as well as their ‘[e]nergy use, fuel mix [and] revenue streams and other effects’. They do not analyse the broader economic impacts beyond those on the global shipping fleet. Since Africa’s shipping fleet is relatively small, and the interest of this report is on the broader economic impacts of shipping tax measures, the above description of DNV’s work is included mainly for completeness.35
There are some similarities between our and UNCTAD’s approaches. Like UNCTAD, we conduct CGE analysis based on the GTAP model (though we use the GTAP-E variation). We also both model a scenario using USD 100 per t to calculate the levy equivalent. However, there are also differences. UNCTAD’s model simplifies the effects of the potential shipping levy and fuel standard as an increase in maritime trade costs, which vary by commodity. While this has the advantage of providing a more accurate model of the increased cost to international trade, UNCTAD does not directly analyse how this will affect the shipping costs faced by different countries’ maritime transport sectors. Using slightly different assumptions, our approach achieves this. As a result, it builds on UNCTAD’s work, and will be particularly useful for understanding the effects of the levy on the shipping sectors of different countries.36
In addition to modelling different options for the carbon levy, UNCTAD also models the global fuel standard that the IMO is proposing to adopt. They also model various scenarios for how the revenues from the levy would be used. Based on our reading of the discussions, it may be premature to model revenue distribution as it remains unclear what are the most likely scenarios for the model to consider.37
Lastly, previous models only examine the impacts of the levy at the aggregate regional or developed level, versus the developing countries level. Our study is far more disaggregated, examining the impacts on a number of individual countries, with particular reference to Africa. In fact, our study is the first to examine how the levy might impact individual countries in Africa.
The impacts of the maritime levy on African economies are presented in this section. These results assume a maritime levy of USD 100 per t of carbon for the analysis.
The increased cost and reduction in supply of maritime shipping services resulting from the maritime levy will impact imports and exports, with varying effects on different countries and sectors. The higher shipping costs will impose additional costs on transportation of merchandise, thereby increasing the price of imports. As a result, international trade will decline on average. Based on 2017 levels, our model finds that, across sectors and the 10 African countries and the ‘Rest of Africa’ region, imports will fall by 0.04% (USD 457 million) while exports will increase by 0.21% (USD 258 million) in aggregate.38 However, the effect differs by sector and by country. Tables 3 and 4 below show the impacts disaggregated by these two variables.
Food trade is of particular interest, given the link to Africans’ livelihoods. To proxy food trade, we look at agricultural commodities (which approximate unprocessed food commodities) and processed food. Our model suggests that adoption of the levy will decrease imports of agricultural commodities in Egypt (0.013% or less than USD 1 million), Morocco (0.011%, again less than USD 1 million), Ghana (0.075% or USD 1.98 million), Nigeria (0.029% or less than USD 1 million), Ethiopia (0.198% or USD 4.14 million) and Rest of Africa (0.019% or USD 4.2 million). This suggests that the levy may reduce the availability of food in these countries. However, the value of food imports increases in the DR Congo (0.016% or less than $1 million), Equatorial Guinea (0.121% or less than USD 1 million), Kenya (0.019% or less than USD 1 million), Zambia (0.009% or less than USD 1 million) and South Africa (0.027% or USD 1.8 million). The different impacts of the levy on agri-food imports in these countries vis-à-vis the other countries are dependent on the structures of the individual economies, their levels of dependence on food imports and the relative levels of domestic and import prices. Given that the model projects that the levy will increase global food and agricultural prices (see Figure 3 below), countries whose domestic prices are higher than the global price experience an increase in agri-food imports, while those with lower domestic prices compared to global prices experience a reduction in agri-food imports.
| Africa Rank | Country | Fleet # | Global Rank |
|---|---|---|---|
| 1 | Liberia | 4,311 | 5th |
| 2 | Nigeria | 832 | 23rd |
| 3 | Sierra Leone | 605 | 30th |
| 4 | Egypt | 436 | 38th |
| 5 | Tanzania | 322 | 43rd |
| 6 | Cameroon | 121 | 62nd |
| 7 | Algeria | 119 | 64th |
| 8 | South Africa | 107 | 66th |
| 9 | Libya | 94 | 71st |
| 10 | Morocco | 93 | 72nd |
The importation of processed foods also falls in all African countries, except Egypt, DR Congo, Kenya and South Africa. Looking at the results, it is clear that the reduced importation, on average, is correlated with the increased margin on imported goods. The varied effects on sectoral imports in the different countries also reflects the differences in the price of domestically produced commodities vis-à-vis imported commodities, as the model assumes that importers choose between different goods based on their price and other factors.
| Sector | Change in imports | Sector | Change in exports | |||
|---|---|---|---|---|---|---|
| USD million | % | USD million | % | |||
| Oil products | -121 | -0.019 | Water transport | -448 | 0.113 | |
| Other manufacturing industry | -102 | -0.025 | Oil products | -26.7 | 0.112 | |
| Crude oil | -97.7 | 0.040 | Coal | 0.44 | 0.006 | |
| Services | -64.8 | -0.086 | Electricity | 1.97 | 0.042 | |
| Water transport | -46.5 | 0.034 | Processed foods | 32.2 | 0.117 | |
| Energy intensive industry | -27.1 | -0.899 | Agriculture | 46.2 | -0.209 | |
| Agriculture | -8.7 | 0.020 | Crude oil | 46.7 | 0.064 | |
| Processed foods | -7.96 | -0.766 | Gas | 48.5 | -7.386 | |
| Electricity | 0.61 | -0.017 | Services | 98.0 | 0.166 | |
| Coal | 3.21 | -0.122 | Other manufacturing industry | 204 | 0.258 | |
| Gas | 15.0 | -0.066 | Energy intensive industry | 255 | 0.100 | |
| Panel A. Change in Sectoral Imports in % (Baseline = 2017) | |||||||||||
|---|---|---|---|---|---|---|---|---|---|---|---|
| Egypt | Morocco | Ghana | Nigeria | DR Congo | Equatorial Guinea | Kenya | Ethiopia | Zambia | South Africa | Rest of Africa | |
| Agriculture | -0.013 | -0.011 | -0.075 | -0.029 | 0.016 | 0.121 | 0.019 | -0.198 | 0.009 | 0.027 | -0.019 |
| Processed Foods | 0.016 | -0.02 | -0.146 | -0.078 | 0.016 | -0.042 | 0.033 | -0.143 | -0.008 | 0.015 | -0.041 |
| Coal | 0.04 | 0.015 | -0.003 | 0.175 | 0.075 | 6.118 | 0.06 | 0.088 | 0.085 | 0.031 | 0.079 |
| Crude Oil | 0.116 | -0.05 | 0.064 | -0.16 | 0.024 | -0.269 | -0.036 | 0.107 | 0.043 | -0.162 | -0.062 |
| Gas | 0.068 | 0.026 | -0.128 | 0.187 | 0.32 | -0.535 | 0.265 | -0.331 | 0.375 | -0.029 | 0.022 |
| Oil Products | 0.65 | 0.015 | -0.043 | -0.159 | 0.057 | -1.581 | 0.128 | -0.025 | 0.055 | -0.054 | -1.22 |
| Electricity | -0.006 | -0.083 | -0.028 | -0.052 | 0.028 | -0.57 | 0.074 | -0.217 | 0.045 | 0.071 | -0.019 |
| Water Transport | -3.724 | -5.058 | -0.766 | -2.747 | -7.848 | 5.849 | -4.27 | 0.154 | -5.969 | -0.545 | -0.361 |
| Energy Intensive Industry | -0.022 | -0.003 | -0.126 | -0.07 | -0.019 | -0.386 | -0.026 | -0.149 | 0.022 | 0.023 | -0.054 |
| Other Manufacturing Industry | -0.085 | -0.102 | -0.384 | -0.258 | -0.14 | -0.402 | -0.102 | -0.281 | -0.061 | -0.1 | -0.162 |
| Services | 0.021 | -0.043 | -0.296 | -0.067 | 0.029 | -0.376 | 0.022 | -0.09 | 0.002 | -0.009 | -0.107 |
| Panel B. Change in Sectoral Exports in % (Baseline = 2017) | |||||||||||
| Agriculture | 0.11 | 0.056 | 0.199 | 0.166 | 0.025 | -0.132 | 0.024 | 0.347 | 0.028 | 0.037 | 0.123 |
| Processed Foods | 0.066 | 0.053 | 0.279 | 0.156 | -0.04 | 0.639 | -0.026 | 0.291 | 0.022 | -0.027 | 0.182 |
| Coal | 0.13 | 0.212 | 0.44 | -0.025 | -0.063 | -13.795 | 0.215 | 0.517 | 0.26 | -0.006 | 0.061 |
| Crude oil | 0.042 | -0.124 | 0.036 | -0.006 | -0.022 | -0.172 | -0.056 | 0.419 | -0.108 | 0.301 | 0.074 |
| Gas | 0.138 | -0.22 | 0.329 | -0.012 | -1.164 | 0.501 | -0.849 | 0.686 | -1.243 | -0.452 | 0.13 |
| Oil products | -0.177 | -0.822 | -1.003 | 0.094 | -1.32 | 0.42 | 0.999 | 0.338 | -0.022 | -0.773 | -0.091 |
| Electricity | 0.113 | 0.126 | 0.249 | 0.134 | -0.104 | 0.955 | -0.02 | 0.54 | 0.02 | -0.026 | 0.126 |
| Water transport | 4.928 | -0.143 | 1.1 | -4.457 | 3.827 | -9.635 | 4.671 | 0.532 | 3.858 | -4.243 | -8.573 |
| Energy intensive industry | 0.192 | 0.161 | 0.378 | 0.262 | 0.041 | 0.783 | 0.074 | 0.409 | 0.09 | 0.085 | 0.263 |
| Other manufacturing industry | 0.266 | 0.21 | 0.518 | 0.431 | 0.121 | 1.13 | 0.089 | 0.648 | 0.192 | 0.188 | 0.36 |
| Services | 0.07 | 0.046 | 0.218 | 0.13 | -0.025 | 0.724 | -0.03 | 0.209 | 0.037 | -0.016 | 0.147 |
For exports, the effects also vary depending on the country and the commodity. The effect of exports depends on the price of domestically-produced commodities vis-à-vis the world export price. As shown in Table 4 Panel B, the model suggests that the exports of agricultural commodities will increase in all the countries except Equatorial Guinea. With global prices of agricultural products increasing as a result of the levy (see Figure 3), there will be a competitive advantage for African countries with lower domestic agricultural prices to increase exports to the global market. However, the exports of fossil energy products (oil products, coal, crude oil and gas) will decline in several African countries. This is in line with the expected reduction in the demand for fossil fuel usage in the maritime industry occasioned by the carbon levy imposed on the sector.
Our results suggest that the imposition of a maritime levy will have a negative effect on GDP in all of the countries and regions in the model except China and South Africa (see Figure 1). China’s GDP is estimated to grow by 0.151% while South Africa’s will grow by 0.009%. The economies of the EU, India, the USA, the UK and Rest of the World will fall by 0.030%, 0.022%, 0.040%, 0.035% and 0.013%, respectively. For African countries (except South Africa), the levy will have varied negative though limited effects on GDP (less than 0.5%), with Equatorial Guinea, Egypt and Ethiopia suffering the largest GDP losses, at 0.121%, 0.117% and 0.103%, respectively.
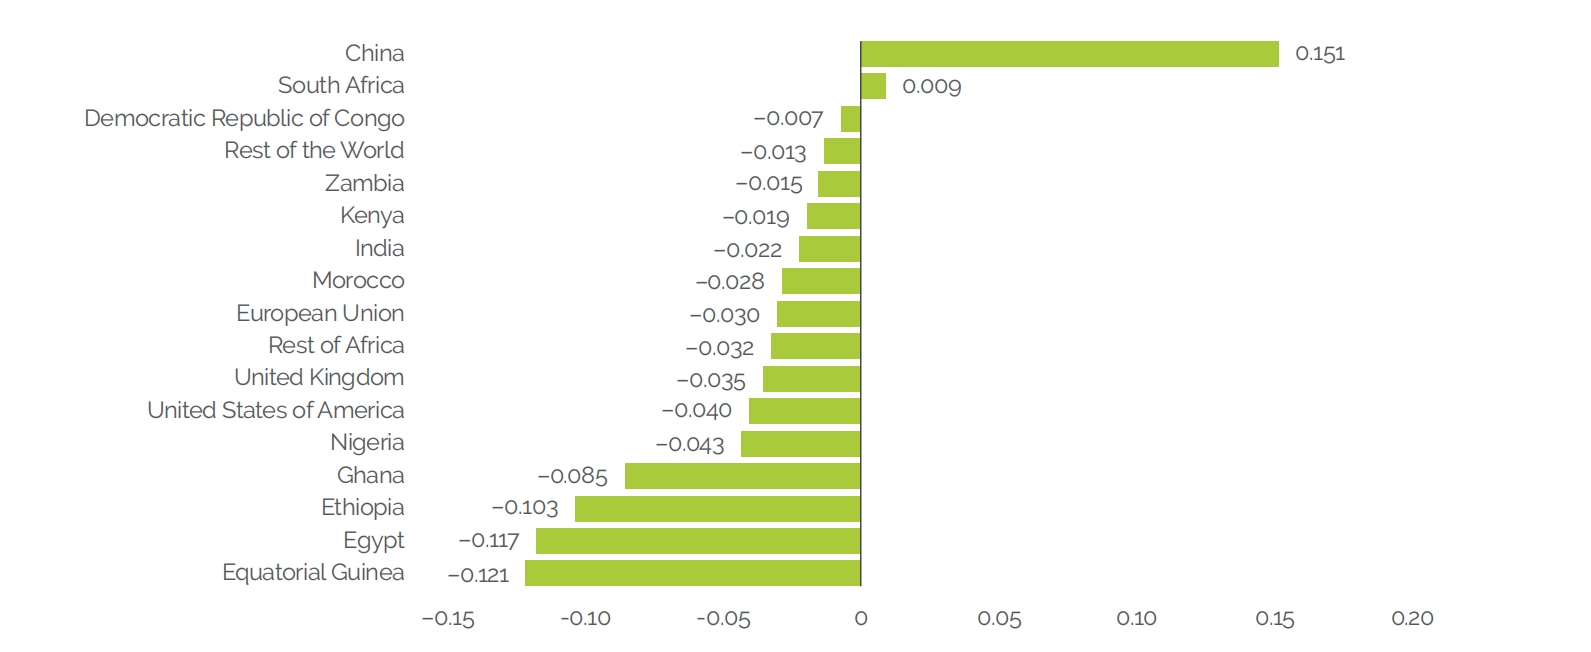
Source: Author’s construct
The increase in the cost of international trade using shipping services could give certain African economies an advantage in exporting to their neighbours when compared with trading partners further afield (by reducing the cost of shipped goods).41 South Africa, as Africa’s most industrialised economy, could be best-placed to take advantage of this state of affairs in increasing its exports to nearby countries (or, rather, countries that are easier to ship to than for South Africa’s closest competitors). In line with this, our model projects that adoption of the levy will increase South Africa’s exports by around USD 100 million in energy-intensive industries and other manufacturing (i.e. manufacturing excluding energy-intensive industries and food processing). The levy will also decrease the country’s imports of other manufacturing, presumably due to the increasing cost of trade resulting from higher shipping costs, which, all things being equal, would contribute to GDP by increasing the output of domestic industry.
We also find that the imposition of the maritime levy will affect the supply of maritime services across the world. The operating cost of the maritime shipping sector will increase, thereby affecting the supply of maritime services. However, our results suggest the supply of maritime shipping services will only increase in the EU, China and Egypt by 3.598%, 8.610% and 4.389%, respectively. The supply of maritime shipping services among African countries will also fall in Morocco (0.193%), Ghana (0.375%), Nigeria (2.818%), Equatorial Guinea (6.534%) and South Africa (4.086%). Meanwhile, our model finds that the reduction in the supply of maritime shipping for international transportation as a result of the levy will lead to an increase in the usage of alternative transport services by 0.024% for Rest of Africa, 0.003% for India, 0.029% for the USA, 0.023% for the UK, 0.043% for Ghana, 0.024% for Nigeria, 0.176% for Equatorial Guinea and 0.043% for Ethiopia.42
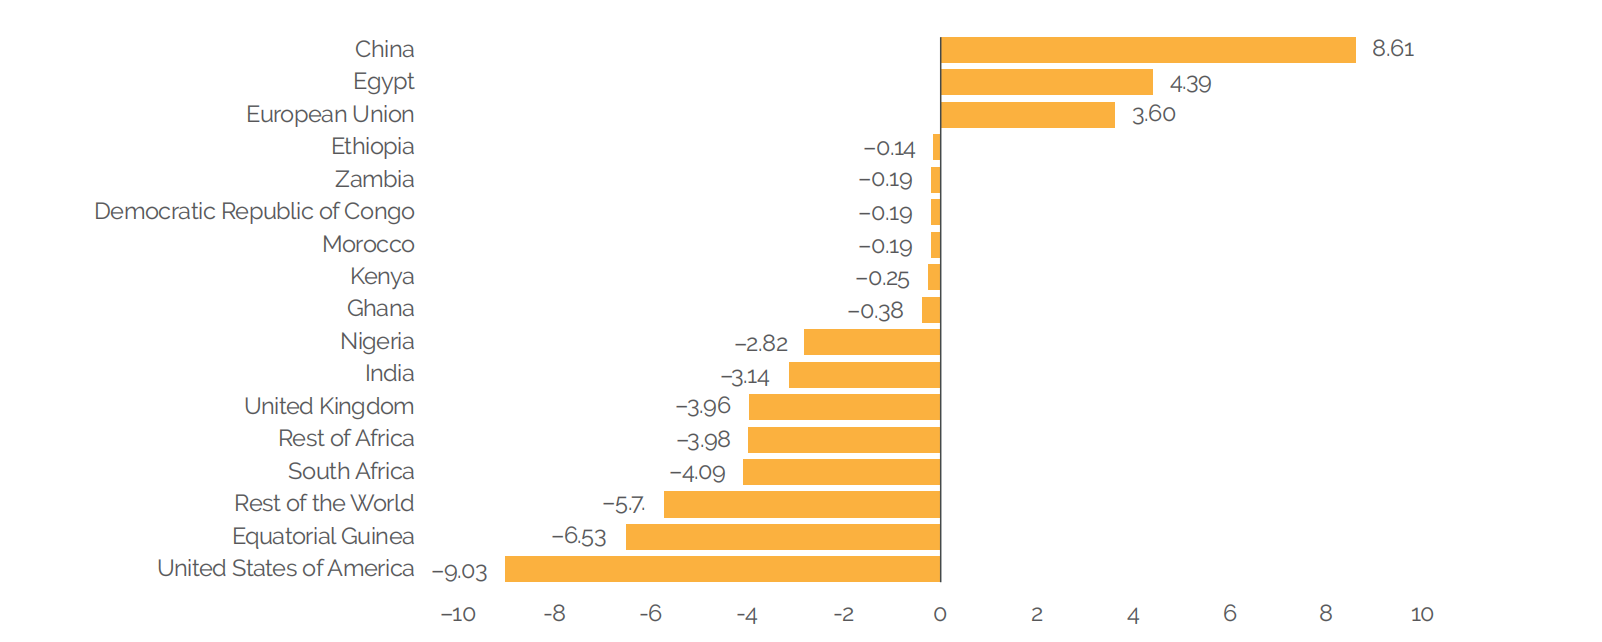
Source: Author’s construct
Our model also finds that the application of the maritime levy will result in an increase in global prices of goods, except for mainly energy commodities whose prices decline (for reasons beyond the levy). The increase in global prices is largely due to the increase in the cost of international shipping of goods. This is shown in Figure 3 below. According to the results, the increase of the price of merchandise goods will be driven by the increase in the price of maritime shipping (0.575%). Global prices of agriculture and processed food commodities will increase by 0.011% and 0.013%, respectively, with implications for food security, especially in developing countries and regions (including Africa) that import a large proportion of their food items. The fall in the prices of energy commodities can be partly attributed to the fall in the demand for energy in the maritime sector resulting from the reduction in the supply of services.
Figure 3. Change in world prices of commodities (%)
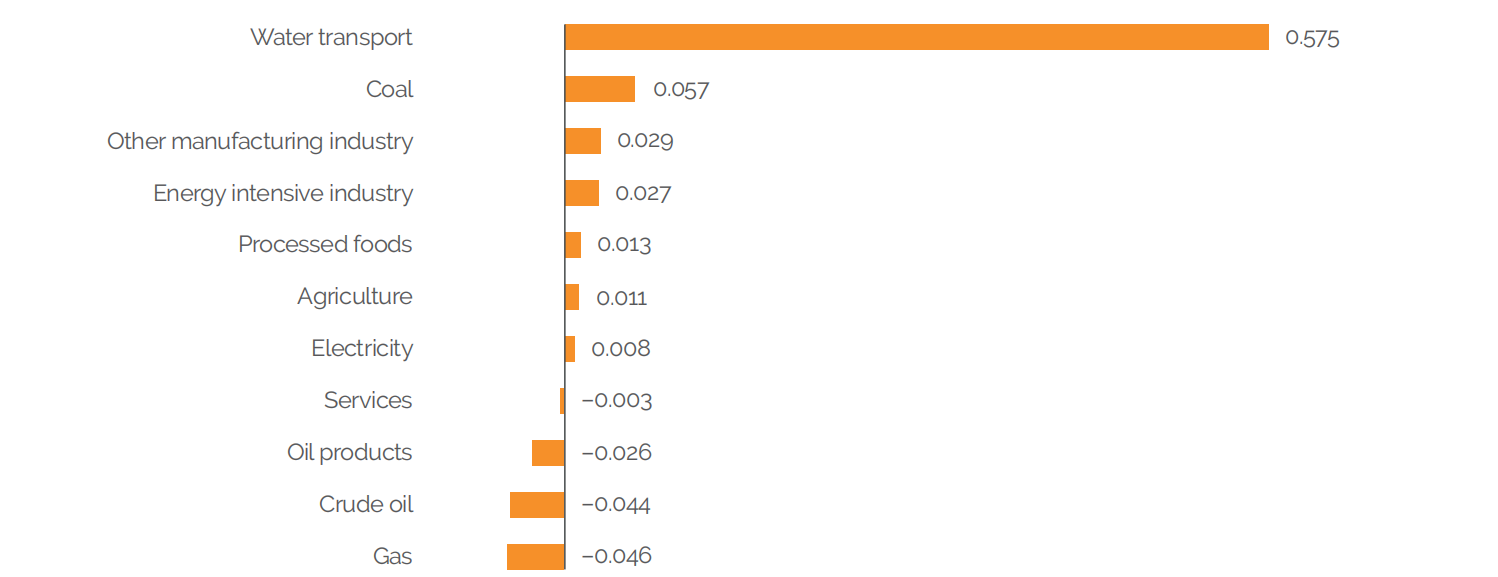
Source: Author’s construct
The levy will also have negative effects on household income, with African countries being disproportionately affected (see Figure 4).43 While household income in the EU, India, the USA, the UK and ROW will fall by 0.041%, 0.021%, 0.04%, 0.034% and 0.009%, respectively, household income in China will increase by 0.148%. In the case of African countries, household income will fall the most, with the magnitude of the reduction reaching 0.123%, 0.101%, 0.106% and 0.115% in Egypt, Ghana, Equatorial Guinea and Ethiopia, respectively. Among the African countries/regions modelled, only South Africa will experience a small increase in household income (about 0.011%).
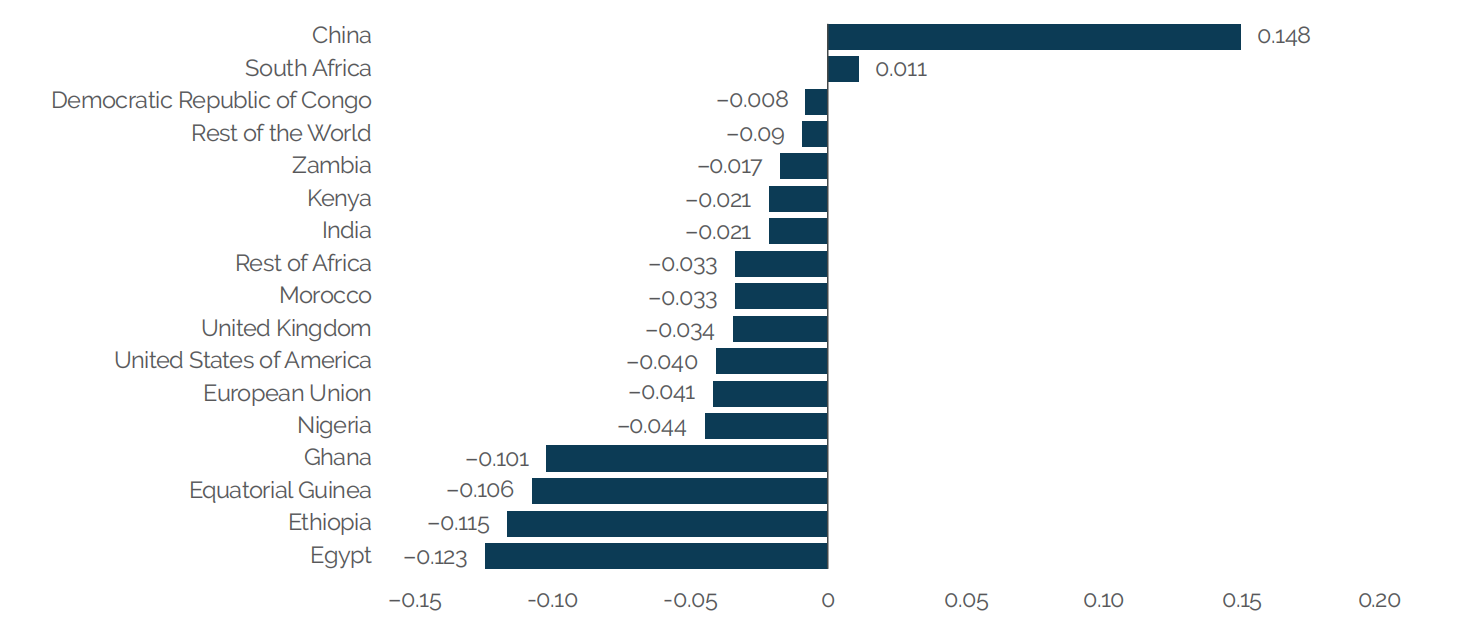
Source: Author’s construct
This section is based on consultations with stakeholders in the Ghanaian maritime sector including port authorities, importers, freight forwarders, agricultural producers, etc. These were engaged to share their views on what the key considerations should be for a shipping tax that would receive their support. Some of the issues raised will arguably apply to other African countries as well.
A summary of the key considerations is provided here:
Due to the structure of trade between Africa and the rest of the world,44 the continent already experiences disproportionately higher freight rates. As an illustration, the sailing distance from Rotterdam to Tema is approximately 4,414 nautical miles, while between Rotterdam and Vancouver it is 11,564 nautical miles. The estimated freight rates for a standard 20’ dry container from Rotterdam to Tema and Rotterdam to Vancouver are USD 1,450 and USD 1,950 respectively.45 46 Calculating the freight per nautical mile gives USD 0.33 for shipping to West Africa compared to USD 0.17 for shipping to Canada. In essence, the West African importer is paying twice as much in freight rates for the same cargo across an equal distance.
This situation has been worsened by the Red Sea disruptions to maritime trade which have led to long deviations around the Cape of Good Hope, adding some 4,000 miles to sailings between the Far East and ports like Tema, Lagos and Abidjan.47 Maersk Line, one of the largest shipping lines in the world, reports that its fuel costs have increased by as much as 40% as a result.48 Therefore, a shipping tax whose calculation is a function of bunkers consumed will only exacerbate the problem by compounding the effects of an imbalance in freight costs with additional carbon costs.
The effect of this is already visible in the impact of the EU-ETS on African routes. Using the example of Rotterdam, Tema and Vancouver, the emissions surcharge published by Maersk Line from Europe to Canada is USD 41 per forty-foot equivalent unit (FEU) while from Europe to West Africa it is USD 149 per FEU.49 The emissions surcharge per nautical mile for Europe-West Africa trade is approximately USD 0.034, whereas for Europe-Canada trade it is EUR 0.0035, making West Africa’s surcharge nearly 10 times that of Canada for each nautical mile sailed. This means that the EU’s carbon tax has 10 times more of a punitive effect on African cargo interests than elsewhere in the globe. If this levy becomes a globalised model, the impact on African cargo would inevitably have a significant negative effect on trade to and from the continent.
For developing countries such as Ghana whose economies depend heavily on exports of high-volume, low-value cargo, the potential exacerbation of freight imbalances is particularly concerning, especially because their export markets are geographically far afield. Ghana exports bulk unprocessed raw materials such as oil, bauxite, manganese and cocoa beans to destinations in Europe, the US and China.50 These longer sailings with their attendant high fuel consumption will have significant impacts on the delivered price of their exports – and thus their competitiveness.
It is therefore imperative that, in adopting the carbon tax, the IMO is cognisant of the trade routes on which the emissions are generated and considers, for example, partially or temporarily exempting specific high-volume, low-value cargo routes or discounting the carbon price for routes with disproportionately negative impacts (DNI), with a view to mitigating the existing imbalances in freight costs.51
Ghanaian importers lamented that the shipowner is the party who makes the decision as to which ships to deploy on any given route: In the African context, shipping lines tend to deploy their older fleets to African ports. At the same time, by virtue of the price inelasticity of freight on African trade routes, shipping lines can easily implement a full pass-through of any cost increases to the African importer, ensuring a full recovery (perhaps even more) from cargo interests. It is therefore to be expected that the full incidence of the proposed shipping tax will fall on the importer with the shipowner permanently adjusting freight rates upwards with little incentive to truly reduce emissions. As the modelling shows, the result is higher freight costs which raise the cost of doing business while failing to meaningfully reduce emissions.
For this reason, technical measures are considered more effective in incentivising change in shipowner behaviour towards greater climate action, though caution is urged in setting the stringency of the standard to allow for the use of transition fuels until such time that zero-emission fuels are economically viable and widely available. On the other hand, flexibility mechanisms such as trading credits and pooling appear to be less desirable as they allow ships to continue to emit.52
It is in no doubt that Africa’s contribution to climate change is limited. Less than 3% of historical GHG emissions are attributable to the continent; even in a 2050 forecast net-zero emissions scenario, the continent will only account for about 4% of global emissions.53 And yet the continent is home to half of the 58 most climate vulnerable countries in the world.54 At the same time, most of these countries are categorised as either developing or least developed economies whose governments have limited fiscal space to engage in climate mitigation spending. Adding to this imbalance is the fact that Africa accounts for less than 2% of the beneficial ownership of the global fleet.55 Therefore, any in-sector distributions of funds raised via the shipping tax will barely impact the continent’s ability to fund new, green ships.
It therefore goes without saying that any measure which does not include a transfer of revenues outside the shipping industry is by default inequitable. Not only must there be out-of-sector distribution, greater weight must be given to the needs of climate vulnerable countries in the administration of these funds.
Ghanaian real sector players expressed strong reservations about the current situation where carbon taxes raised by the EU-ETS on routes to/from Africa are placed into the EU's Innovation Fund and used only to fund the development of new greener technologies in Europe. Reports estimate that Ghana alone is contributing an estimated EUR 90 million to the EU economy each year with some EUR 3 billion per annum expected from the African continent.56 The idea that Africans pay a European tax does not augur well for an equitable maritime decarbonisation.
Fundamental to pollution management is the ‘polluter pays’ principle. This is a generally accepted practice whereby those who create pollution are made to pay for the cost of managing that pollution to prevent or reduce damage to human health or the environment. Climate action is premised on this key principle. It should therefore be reflected in how funds raised via the IMO’s measures for use in funding out-of-sector mitigation and resilience projects are transferred to recipient climate-vulnerable countries.
If we recognise that the shipping industry has historically contributed to the current climate crisis, and we agree that the maritime fleet is not controlled by Africans, then it stands to reason that the large shipowner countries should bear the cost of repairing the damage caused by their emissions and the cost of mitigation and embedding resilience to withstand the effects of climate change. This would mean that the transfer of revenues directly to African member states treasuries or projects would take the form of grants or similar, rather than debt and/or interest-bearing instruments.
Further to this, should the IMO look to utilise the existing climate finance funds to administer revenues generated from the GHG emissions measures, new fit-for-purpose policies will need to be implemented. The current set-up – where climate funds require most, if not all, projects that they fund to overcome the thresholds of financial viability and commercial risk mitigation in assessing bankability – does not fit within the context of the polluter paying for the costs of correcting the externalities arising from their activities.57
One area of significant concern is the lack of clarity around how countries will be assessed for the purposes of redistributing revenues raised from the GHG emissions measures. The IMO broadly categorises countries as ‘developed’ or ‘developing’ (SIDS, landlocked developing countries [LLDCs] and least developed countries [LDCs]). As currently defined, countries like Ghana and Seychelles have peculiar characteristics which mean that, if national income is used as the only criteria, they are likely to be inequitably impacted by the redistribution of tax revenues.
As an illustration, Ghana, like its LDC-neighbours Togo, Liberia and Guinea, is located along the Gulf of Guinea. Although they all have a similar climate vulnerability, Ghana is classified as lower middle-income and is therefore unlikely to qualify for the redistributions reserved for its neighbours. Contrast this with the case of Singapore, which is categorised as a SIDS and is therefore likely to benefit from the revenues reserved for such states, although its economy is seven times the size of Ghana’s and 300 times the size of African island state Seychelles.58 59 60
To emphasise the point, as a developing country, Ghana is placed in the same bracket as China, Brazil and Argentina. Some of these have economies larger than Ghana’s; all have a higher gross national income per capita (GNI PC). Traditionally, assessment of a country’s need for international assistance has been measured by its GNI PC because the measure has been preferred by the aid community as a reliable and easily accessible indicator of the quality of life in a country. However, the measure has been found to be deficient, particularly in the case of SIDS whose GNI PC is relatively high due to their small population size, but who have a significant need for developmental assistance to overcome the high-risk, high-impact natural disasters that cost their economies as much as 9% of annual GDP each year.61 This deficiency has led to a strong argument being made for the development of a Multidimensional Vulnerability Index (MVI) which factors the vulnerability and (lack of) resilience of SIDS in the areas of environment, society and economy.62
Given that some developing countries like Ghana face a similar climate vulnerability to many LDCs but would not qualify under GNI PVC-only criteria – even though they have a limited ability to bear the adverse impacts of climate change – a quantitative measure like the MVI for all developing countries (not only SIDS) would be important when determining how the revenues raised from the implementation of the GHG emission measures should be allocated.
The final point on the categorisation of countries is how much the country itself has historically contributed to global emissions. China, for example, though still classified as a developing country, is the single largest emitter, accounting for some 37% of global emissions, reportedly more than the entire developed world combined.63 64 It also has the second largest beneficial ownership of the global fleet.65 As pointed out in the modelling results, China will have an unfair advantage over many other developing countries if the country’s own historical contribution to emissions is not factored into its assessment for redistribution.
An equitable redistribution of revenues will be more likely achieved if the IMO recognises four key criteria: (i) an objective climate vulnerability measure of exposure to climate hazards; (ii) empirical results of studies on Disproportionate Negative Impacts as a proxy for the impact of the GHG measures on countries’ economies; (iii) national income as a proxy for a country’s ability to afford to correct the adverse impacts of climate change itself; and (iv) the country’s own ranking in terms of its contribution to emissions.
The vast solar resources available in Africa mean the continent has great potential as a producer of green hydrogen – a vital energy carrier for powering zero-emission ships and industrialisation. The European Investment Bank, in its report titled ‘Africa’s Extraordinary Green Hydrogen Potential’, estimates that green hydrogen could result in the reduction of emissions on the continent by as much as 40%.66
If set at a sufficiently stringent level, the IMO’s GHG fuel standard would incentivise the development and commercialisation of large hydrogen projects across the continent, boosting economies while accelerating the transition to a green economy. Hydrogen projects under consideration in countries like Mauritania, Djibouti, Namibia and Egypt could overcome the barrier of uncertainty of offtake and achieve bankability. This way, the decarbonisation of the maritime sector could enable the continent to produce 5 000 Mt of hydrogen per year at less than USD 2 per kg, enough to meet today’s total global energy demand.67
Thanks to Chinese beneficial ownership, the developing world controls about 45% of the global fleet. However, many developing countries control very few ships. It is of immense concern, particularly to African maritime administrators, that the application of a very high WtW GHG intensity fuel standard does not suddenly render these limited fleets obsolete. Studies by Marie Fricaudet et al. (2022) explore the risk of stranded assets in the maritime industry from climate action.68 69
Data from UNCTAD70 show that the bulk of the African fleet is composed of old tankers. These stand to be affected by the IMO’s levy in two ways: Firstly, they risk losing cargo altogether as fossil fuels are phased out; secondly, they run on heavy fuel oil and marine diesel engines which are too expensive to retrofit. Therefore, Ghanaian maritime stakeholders view the candidate measures based on TtW calculations as the better option for phasing out the existing fleet and avoiding a sudden collapse of the country’s maritime sector.
Allowing for the redistribution of revenues to be used out-of-sector in climate vulnerable countries is essential for trading off the negative impacts of a shipping tax on African economies. A critical area for achieving trade-offs would be in financing climate-resilient agricultural technologies. As the modelling results show, food insecurity, which is already a major issue for most African countries resulting from geopolitical disruptions and adverse climate change, will be worsened by the resulting increase in shipping costs. One way to mitigate these impacts would be for redistributed revenues to be used to fund new technologies that enhance the resilience of the continent’s agricultural production and output.
African governments are carrying enormous debt burdens with limited headroom for infrastructure spending. Redistributed revenues would be a welcome source of funding for large-scale resilience infrastructure or agricultural programmes and would remove the almost impossible hurdles faced by projects seeking traditional project financing.
The analysis and modelling above highlights a number of considerations that African countries need to take into account when formulating their position at the IMO. While the impact of the IMO’s proposed carbon tax on their GDP may be small, consideration should be given to mitigating its impact on other socio-economic aspects such as food prices and exports (which in turn impact the countries’ fiscal sustainability). In theory, the positive effects of such a tax on reducing GHG emissions could counteract these economic effects and boost economic output over the long term. However, given the negative economic impacts on African economies that our analysis identifies, it remains unclear whether a carbon tax would be in Africa's interests unless the resulting revenues are distributed in the continent's favour.
It is imperative for the outcome of the IMO negotiations to ensure that costs and benefits of efforts to cut emissions from shipping are equitably shared between countries. Distributing the revenues raised should not be in proportion to country fleet ownership; this would only boost economies that are capable of adapting without international finance at the detriment of less well-resourced economies. Rather, considering the multi-dimensional effect of this tax, a multi-focused and phased set of measures are required.
Ghanaian stakeholder engagements reveal a significant amount of hesitation towards the introduction of a shipping tax, given their experience following the introduction of the EU-ETS in January 2024. Importers especially lament the increased cost of doing business that will arise from the imposition of GHG measures and assert that these will have significant adverse effects on their businesses.
For any of the candidate measures to attract support from the maritime sector in Ghana and the majority of African states, it is essential that due consideration be given to the existing structural imbalances and, where possible, partial or temporary exemptions be applied to African exports. It is also important that the IMO commits to redistributing a significant portion of the revenues raised from the mid-term measures towards funding out-of-sector mitigation and resilience in ports, agriculture, renewable energy production, etc. These opportunities for achieving trade-off will help to mitigate the higher costs of doing business. In recognising that countries have different circumstances, any redistribution should be carried out with due regard to a country’s climate vulnerability, national income, how disproportionately it is negatively impacted by the measures as well as its own contribution to GHG emissions. Lastly, and perhaps most importantly, if redistributions are to truly reflect the principle of polluter pays, they should be in the form of direct transfers, not loans or interest-bearing instruments.
BBC. (2021, May 7). China emissions exceed all developed nations combined. Retrieved from https://www.bbc.com/news/world-asia-57018837
Caldecott, B., & McDaniels, J. (2014). Stranded generation assets: Implications for European capacity mechanisms, energy markets and climate policy. Smith School of Enterprise and the Environment.
Center for Strategic and International Studies. (2022, July 20). The Case for a Globally Accepted Vulnerability Index. Retrieved from https://www.csis.org/analysis/case-globally-accepted-vulnerability-index
Department of Statistics Singapore. (n.d.). Visualising Data. Retrieved July 9, 2024, from SingStat Website: https://www.singstat.gov.sg/find-data/search-by-theme/economy/leading-indicators/visualising-data
Dominioni, G. (2024). Carbon pricing for international shipping, equity, and WTO law. Review of European, Comparative and International Environmental Law.
Dominioni, G., & Englert, D. (2022). Carbon Revenues from International Shipping: Enabling an Effective and Equitable Energy Transition - Technical Paper.
Dr. Smith, T., Dr. Baresic, D., Fricaudet, M., Frosch, A., Dr. Rehmatulla, N., Perico, C., & Dr. Chin-Yee, S. (15 March 2024). An overview of the discussions from the IMO ISWG-GHG 19 - A readout by UMAS. UMAS. Retrieved from https://www.u-mas.co.uk/wp-content/uploads/2024/03/ISWG-16-UMAS-readout-final.pdf
European Commission. (2024, June 3). Decarbonising maritime transport – FuelEU Maritime. Retrieved from Mobility and Transport: Decarbonising maritime transport – FuelEU Maritime
European Commission. (n.d.). FAQ – Maritime transport in EU Emissions Trading System (ETS) - European Commission. Retrieved August 31, 2024, from European Commission Climate Action - Use of Revenues: https://climate.ec.europa.eu/eu-action/transport/reducing-emissions-shipping-sector/faq-maritime-transport-eu-emissions-trading-system-ets_en
European Investment Bank. (2022, December 21). New study confirms €1 trillion Africa’s extraordinary green hydrogen potential. Retrieved from www.eib.org: https://www.eib.org/en/press/all/2022-574-new-study-confirms-eur-1-trillion-africa-s-extraordinary-green-hydrogen-potential
European Union. (2024, May 20). Reducing emissions from the shipping sector. Retrieved from https://commission.europa.eu/energy-climate-change-environment_en
European Union. (2024, May 20). What is the EU-ETS? Retrieved from https://climate.ec.europa.eu/eu-action/eu-emissions-trading-system-eu-ets/what-eu-ets_en
Fricaudet, M., Dr. Smith, T., & Dr. Rehmatulla, N. (2022, February 16). Understanding the scale of the stranded assets risk in the shipping industry. Retrieved from https://www.ssrn.com/: https://papers.ssrn.com/sol3/papers.cfm?abstract_id=4036552
GCB Bank. (2023). Cocoa Sector Analysis 2023. Strategy and Research Department.
Green Climate Fund. (n.d.). Investment Criteria Scorecard. Retrieved July 10, 2024, from https://www.greenclimate.fund/sites/default/files/document/gcf-appraisal-guidance-annex-1-v3.pdf
International Energy Agency. (2023). Africa Energy Outlook 2022. International Energy Agency. Retrieved from https://iea.blob.core.windows.net/assets/220b2862-33a6-47bd-81e9-00e586f4d384/AfricaEnergyOutlook2022.pdf
International Energy Agency. (2023). CO2 emissions from international shipping in the Net Zero Scenario, 2000-2030 – Charts – Data & Statistics - IEA. Retrieved from International Shipping: https://www.iea.org/data-and-statistics/charts/co2-emissions-from-international-shipping-in-the-net-zero-scenario-2000-2030-3
International Maritime Organisation. (2024). Consideration of a ‘Green Balance Mechanism' Submitted by the World Shipping Council. 16th Session of the Intersessional meeting of the Working Group on reduction of GHG emissions from ships. Retrieved from https://static1.squarespace.com/static/5ff6c5336c885a268148bdcc/t/65cccc17dfd414275c8d0744/1707920409442/WSC+Green+Balance+Mechanism+23+Jan+2024.pdf
International Maritime Organisation. (1990, March 16). International Convention for the Prevention of Pollution from Ships, 1973. Retrieved from https://library.arcticportal.org/1699/1/marpol.pdf
International Maritime Organisation. (2020). Fourth IMO Greenhouse Gas Study. Retrieved from https://wwwcdn.imo.org/localresources/en/OurWork/Environment/Documents/Fourth%20IMO%20GHG%20Study%202020%20-%20Full%20report%20and%20annexes.pdf
International Maritime Organisation. (2023). 2023 IMO Strategy on Reduction of GHG Emissions from Ships. The Marine Environment Protection Committee.
International Maritime Organisation. (2024, June 24). GHG-EW 3-INF.3 - Factsheet on International Maritime Sustainable Fuels and Fund Mechanism (China). Retrieved from Comparative analysis of candidate mid-term measures: https://wwwcdn.imo.org/localresources/en/OurWork/Environment/Documents/Expert%20workshop/Factsheets/GHG-EW%203-INF.3%20-%20Factsheet%20On%20International%20Maritime%20Sustainable%20Fuels%20And%20Fund%20Mechanism%20(China)%20(2).pdf
International Maritime Organisation. (2024, June 25). GHG-EW 3-INF.8 - Factsheet on Greenhouse Gas Fuel Standard (Germany). Retrieved from Comparative analysis of candidate mid-term measures: https://wwwcdn.imo.org/localresources/en/OurWork/Environment/Documents/Expert%20workshop/Factsheets/GHG-EW%203-INF.8%20-%20Factsheet%20On%20Greenhouse%20Gas%20Fuel%20Standard%20(Germany)%20(1).pdf
International Maritime Organisation. (2024). IMO Briefing: 16th Intersessional Working Group on Greenhouse Gases & 81st Maritime Environment Protection Committee.
Maersk. (2024, June 12). Navigating Challenges in the Red Sea and Beyond. Retrieved from Maersk.com: https://www.maersk.com.cn/news/articles/2024/06/12/navigating-challenges-in-red-sea-and-beyond
Maersk. (2024, March 1). Rate Announcements - Emissions surcharge (EMS/ESS). Retrieved from Maersk.com: https://www.maersk.com/news/category/rate-announcements
Ogbugo, M. (2024, January 15). Ghana to lose €90m per annum to EU-ETS shipping carbon tax. Retrieved from https://thebftonline.com/2024/01/15/ghana-to-lose-e90m-per-annum-to-eu-ets-shipping-carbon-tax-2/
UN Trade and Development. (2022, November 29). UNCTAD’s Review of Maritime Transport 2022: Facts and Figures on Africa. Retrieved from https://unctad.org/press-material/unctads-review-maritime-transport-2022-facts-and-figures-africa
UN Trade and Development. (2023, November). Policy Brief No. 112. Retrieved from UNCTAD: https://unctad.org/system/files/official-document/presspb2023d6_en.pdf
UN Trade and Development. (2023). Review of Maritime Transport 2023. Towards a Green and Just Transition. Geneva: United Nations publication. Sales No. E.23.II.D.23.
UN Trade and Development. (2024, June 5). UNCTAD statistical portal. Retrieved July 9, 2024, from Merchant fleet by country of beneficial ownership, annual: https://unctadstat.unctad.org/datacentre/dataviewer/US.FleetBeneficialOwners
United Nations President of the General Assembly. (2024). High level panel on the development of a Multidimensional Vulnerability Index Final Report. Retrieved from https://www.un.org/ohrlls/sites/www.un.org.ohrlls/files/final_mvi_report_1.pdf
Senior Business Executive in the West African Maritime Sector
Professor in Practice at the Firoz Lalji Institute for Africa
Economist and Senior Research Fellow at NILDS, Nigeria
Visiting Fellow with the Firoz Lalji Institute for Africa
Executive Director at the African Future Policies Hub