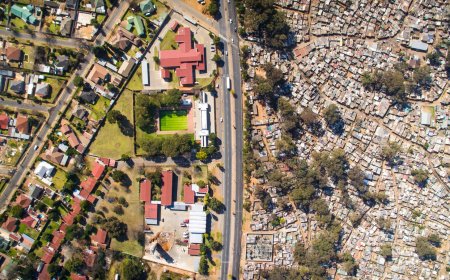
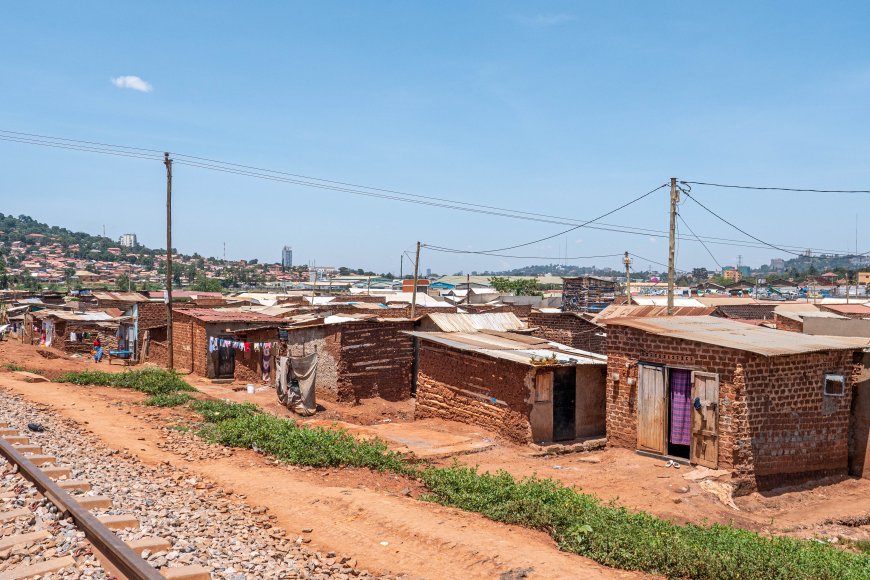
Schwerwiegende städtische Probleme in Afrika: Geovisualisierung der Ausbreitung informeller Siedlungen in Nairobi (EN)
Die informellen Siedlungen in Nairobi stellen ein komplexes sozioökonomisches Problem dar, das visuell nicht erkennbar ist. Die Geovisualisierung bietet eine praktische und kostengünstige Lösung, um diese methodische Lücke zu schließen.

Summary
-
Technically diverse approaches and toolsets are currently employed for mapping and interpreting the spatial analysis of informal settlements in Nairobi.
-
These fragmented and inconsistent methodologies used to map Nairobi’s Informal Settlements hamper the success of government programmes such as the Kenya Slum Upgrading Programme (KENSUP) and the Kenya Informal Settlements Improvement Project (KISIP).
-
The current workflow is poorly integrated and lacks clear visualisation regarding the growth of informal settlements and their relationship to gaps in basic service provision and the increased vulnerability of these settlements to climate change impacts such as flooding or health risks.
-
Geo-visualisation tools such as ArcGIS StoryMaps and 3D Flood Simulations offer a transformative alternative. These tools integrate spatial and temporal data to create interactive, intuitive maps that enhance monitoring, foster cross-sectoral coordination, and support informed decision-making.
Background
The attainment of Sustainable Development Goal 11 - ‘Sustainable Cities and Communities’- is high on Kenya’s development priorities. SDG 11 provides the international standard that Kenya’s Vision 2030 translates into national objectives, which the Nairobi County Integrated Development Plan (CIDP) then operationalises through specific local projects such as the Kenya Informal Settlements Improvement Project (KISIP). However, the uncontrolled proliferation of informal settlements in Nairobi is undermining these ambitions, particularly the attainment of SDG targets 11.1 (safe and affordable housing), 11.2 (affordable and sustainable transport systems), and 11.6 (reduce the environmental impacts of cities). Despite decades of policy and interventions to upgrade the mapping of the informal settlements, these informal settlements continue to grow at an alarming rate, both in Nairobi and across the country. This expansion is being driven by systemic gaps in land governance, fragmented mapping methodologies and policy implementation, and a lack of coordinated urban planning strategies.
Urban planners and decision-makers in Nairobi face a significant challenge: Current data collection and analysis methods on informal settlements are disjointed across institutions, resulting in inconsistent, outdated, and sometimes unreliable datasets. The lack of an integrated geospatial workflow – from field data collection to analysis and visualisation – limits real-time insight into informal settlements' dynamics. Furthermore, access to Very High Resolution (VHR) satellite or drone imagery remains limited due to cost barriers and technical constraints, leaving planners dependent on low-resolution or outdated imagery. This gap compromises the accuracy of spatial analysis and the effectiveness of evidence-based planning under programmes such as the Kenya Slum Upgrading Programme (KENSUP) and the Kenya Informal Settlements Improvement Project (KISIP).
Against this background, this study aims to evaluate the existing methodological gaps in Nairobi’s urban data systems and propose a geo-visualisation-based workflow that integrates real-time mapping, analysis, and visualisation. By doing so, it seeks to enhance decision-making, improve monitoring of the expansion of informal settlements, and promote spatially informed urban governance.
Historical context of informal settlements in Nairobi
The origins of informal settlements in Nairobi lie in colonial-era urban policies, which enforced racial segregation and excluded Africans from formal urban residence. This legacy of spatial inequality established the foundation for informal urban development (White, Silberman, & Anderson, 1948; Abbott, 2002; United Nations Human Settlement Programme, 2003). During the post-independence period (1960s-1970s), the Kenyan government assumed economic growth would naturally eliminate informal settlements, a view which neglected issues of urban poverty (Abbott, 2002; Arimah, 2010; Wamuchiru, 2014). When this approach failed, the state adopted informal settlements’ clearance and forced mass evictions, which displaced residents and fueled new informal settlements. Meanwhile, corrupt officials were bought out by investors/speculators, diverting the advantages of informal settlement clearances away from the poor (Abbott, 2002; United Nations Human Settlement Programme, 2003).
The 1980s and 1990s marked a shift to in-situ upgrading and site-and-service schemes (as seen in the neighbourhoods of Dandora and Umoja), intended to provide basic infrastructure and tenure (Huchzermeyer, 2008). Yet corruption, speculative land acquisition, and the displacement of low-income residents undermined these programmes (Mayo & Gross, 1987; Pugh, 1994; Otiso, 2003; Muraya, 2006; Huchzermeyer, 2008; Bagheri, 2012). In the 2000s, pro-poor initiatives like KENSUP were introduced, targeting millions of urban poor. However, their top-down implementation resulted in middle-class gentrification of settlements such as Kibera, which were meant for low-income dwellers (Wamuchiru, 2014; Mkoli R. M., 2020). The 2010 Constitution recognised housing as a human right, leading to the Kenya Informal Settlement Improvement Project (KISIP) – a more participatory framework (Ministry of Lands, 2023; OpenEdition Journals, 2021).
Despite some evolution in policy, over 60% of Nairobi’s population still lives in informal settlements (UN-Habitat, 2021). This figure is rising. For example, the population of the Kibera informal settlement grew from 199,339 in 2019 to 549,322 in 2025 (an annual growth rate of 18.3%). Similarly, in Mathare the population grew from 114,329 in 2019 to 239,000 in 2025 (an annual growth rate of 13%). These settlements continue to embody Nairobi’s urban wicked problem, and illustrate the persistent gap between policy intent and spatial realities.
Limits of current informal settlements mapping tools
The use of Geographical Information Systems (GIS) in Kenya dates back to the early 1990s, roughly a decade after civilian applications emerged globally. By 1992, several institutions including the United Nations Environment Programme (UNEP), the International Centre of Insect Physiology and Ecology (ICIPE), the Kenya Rangeland Ecological Monitoring Unit (KREMU) (now the Directorate of Resource Surveys and Remote Sensing (DRSRS)), International Livestock Research Institute (ILRI), the Centre for International Forestry Research and World Agroforestry (ICRAF), and the country’s national museums had adopted GIS technology for environmental and spatial analysis. One of the earliest attempts to map informal settlements was the project ‘Nairobi's Informal Settlements: An Inventory’, developed using aerial photography from 1993. While this initiative provided data on settlement size, location, and density, it lacked ground-level detail and community participation, offering only a static, time-bound snapshot.
Between 1990 and 2010, urban planners increasingly adopted remote sensing imagery to detect spatial changes in informal settlements, such as in Kawangware and Mathare. A landmark initiative – the Map Kibera Project (2009) – revolutionised mapping by involving community members using handheld Global Positioning System (GPS) devices and OpenStreetMap (OSM) tools to create the first open-source map, a participatory digital map of an informal settlement. Following this, Participatory GIS (PGIS) approaches gained traction, emphasising community involvement in mapping urban growth and social infrastructure. Examples include household enumeration in Kisumu (Macoloo & Owusu, 2010), ‘Map Mathare’ (Watkins & Kanyinga, 2013), and the ‘Scenerii Planning Tool' used in Bondeni, Nakuru. However, most of these efforts were pilot projects with limited continuity and lacked integration with government databases.
By the early 2010s, the Government of Kenya sought to formalise geospatial planning through legislation. Nevertheless, the County Government Act (2012) and the Physical and Land Use Planning Act (2019) mandated counties to establish GIS-based planning databases. Despite these provisions, mapping of informal settlements remained underdeveloped and was often conducted independently by donor agencies, NGOs, or research institutions without a unified data schema or consistent methodology. A notable example is KISIP, which mapped 143 informal settlements across Nairobi using GIS. Data was collected using handheld Global Positioning Systems (GPS) and overlaid on satellite images. The exercise was very generic, however, with no clear data structure or schema; Only locational and land-use maps were produced. This was due to the provisions in the relevant legislation not being specifically tailored for mapping informal settlements.
In 2025, KISIP mapped 209 informal settlements using a multi-tool workflow. Data was collected via ODK Central, coded in Excel-based survey forms, processed using QGIS (via the ODK Connector plugin), and further analysed in ArcGIS Desktop. This method, though comprehensive, was inherently fragmented – requiring manual data transfers across platforms. It utilised ESRI basemaps, which are often outdated, and relied on open-source tools not optimised for large-scale, real-time analysis. As such, it did not constitute an integrated system. Instead, as is often the case with such methods, inefficiencies and fragmentation across the data workflow increased data handling errors and impeded continuous visualisation of settlement growth. Moreover, the absence of an integrated schema or centralised platform meant data could not be easily updated or shared among agencies, leading to redundancy and policy misalignment.
These limitations underscore the urgent need for a centralised, interoperable geo-visualisation platform— one capable of unifying data collection, analysis, and visualisation within a single interface. Such a platform should allow for seamless, end-to-end workflows, ensuring real-time monitoring and dynamic visualisation of spatial data. Geo-visualisation tools, such as ArcGIS StoryMaps and 3D flood simulation models, present viable solutions to these challenges. By merging technical precision with interactive visualisation, they transform static spatial data into actionable intelligence. The following section demonstrates, through a Mathare case study, how these tools can enhance urban policy decision-making and disaster risk management in Nairobi.
The approach: leveraging geo-visualisation tools
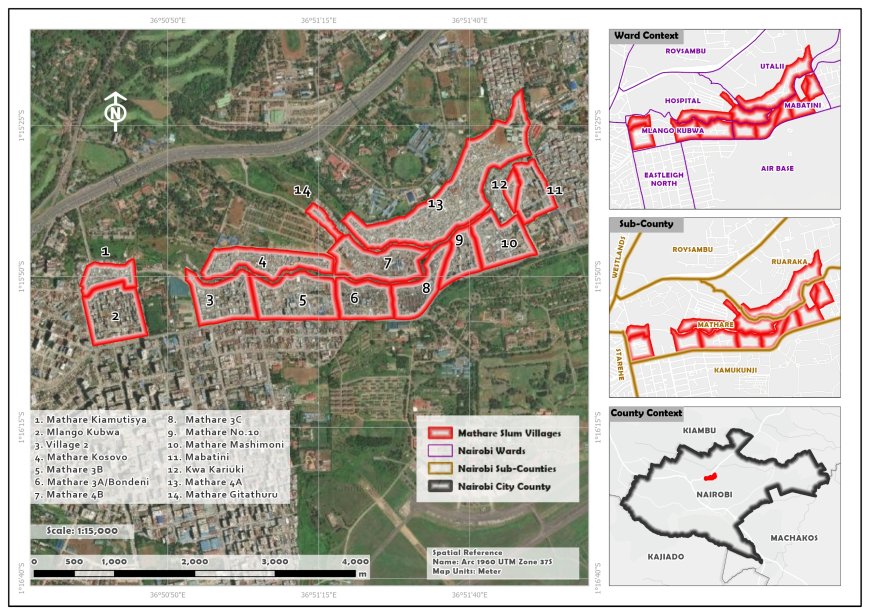
Geo-visualisation combines advanced GIS technology, remote sensing, and interactive web-based visualisation to enable users to interact with real-world spatial phenomena. It transforms raw geospatial data into dynamic visual narratives such as StoryMaps, 3D models, and interactive web maps – that enhance comprehension and communication of complex urban issues such as the proliferation of informal settlements in Nairobi. To demonstrate the practical value of geo-visualisation tools in policy-oriented urban analysis, this study employs Mathare informal settlement as the case study area. Located approximately seven kilometres northwest of Nairobi Central Business District, Mathare represents the city’s oldest and most densely populated informal settlements. It exhibits high rates of population growth (13% per year), precarious housing, and recurrent flooding – making it an ideal site for analysing spatiotemporal changes and demonstrating the practical value of geo-visualisation tools in policy-oriented urban analysis. Figure 1 shows the location of Mathare in Nairobi.
Figure 1: Location of Mathare informal settlement in Nairobi
Methodology for geo-visualisation
Tool 1: ArcGIS StoryMaps
The first tool utilised is ArcGIS StoryMaps, which integrates maps, narratives, and multimedia into an interactive online storytelling environment. The geo-visualisation process begins with spatial data collection and analysis in ArcGIS Desktop and ArcGIS Pro, where datasets are prepared, styled, and symbolised for web publication. The prepared maps are then published to ArcGIS Online, where they are combined with descriptive text, photographs, charts, and satellite imagery to create an interactive StoryMap. Unlike the current fragmented tools (ODK Central, Excel, ArcGIS, QGIS), and conventional GIS reports that require technical expertise to interpret, StoryMaps transforms geospatial data into an accessible, narrative-driven experience that enables policymakers, planners, and citizens to explore and understand settlement dynamics intuitively. Additionally, unlike QGIS, ArcGIS StoryMaps offers documentation in the form of training resources and technical support.
High-resolution Planet Imagery (acquired through the Planet Research and Education account) was used to capture temporal changes in Mathare informal settlement between 2019 and 2025. The swipe template in Planet Stories was applied to allow side-by-side comparison of land cover imagery from both years, providing a visual representation of settlement expansion. The complete StoryMap, integrating imagery, thematic maps, and analysis is accessible here. Figure 2 demonstrates the swiping.
Figure 2: Comparison of the growth of Mathare informal settlement from 2019 to 2025
Quantitative change detection was performed to assess Land Use and Land Cover (LULC) transitions. The analysis categorised land into four classes: Built-up, Bare-land, Water, and Vegetation. The percentage change between 2019 and 2025 was computed to show the degree of the built-up area expansion and the corresponding reduction in vegetation cover. The results are presented in Figure 3, revealing the continuing densification of the settlement core and loss of green buffer zones along the Mathare River corridor.
Figure 3: Percentage change detection analysis for Mathare informal settlement between 2019 and 2025
Tool 2: Africa GeoPortal 3D Flood Simulation
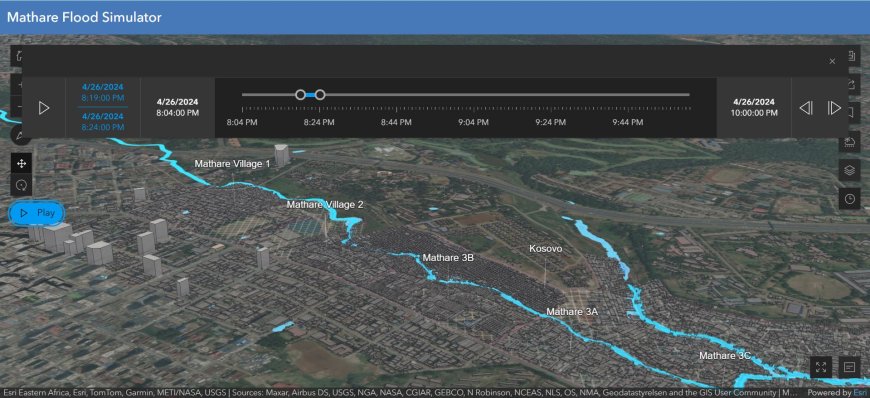
The second tool used is the Africa GeoPortal, a free, cloud-based spatial platform powered by Esri. The GeoPortal provides African researchers and planners with access to curated geospatial data, analytical tools, and visualisation resources. Unlike open-source GIS applications such as QGIS, which are primarily desktop-based, Africa GeoPortal supports interactive, web-based analysis and 3D visualisation – making it suitable for public communication and participatory planning. For this study, the 3D Flood Simulation tool in ArcGIS Pro was employed to model flood scenarios for Mathare based on recorded rainfall and drainage data of April 26, 2024. The simulation modelled stream overflow and surface runoff, generating a water depth layer, which was exported as a NetCDF file and uploaded to Africa GeoPortal.
A time-enabled 3D web scene was created using building footprint data from the ArcGIS Living Atlas of the World. The model was then configured using the 3D Viewer template, enabling users to interactively explore flood extents and potential impacts on residential structures and access roads. This interactive 3D environment enables decision-makers to visualise the spatial impact of floods in real time, supporting early warning systems and proactive urban planning. As illustrated in Figure 4, the simulation demonstrates how geo-visualisation tools can translate complex hydrological data into policy-relevant visual insights. It can be accessed here.
Figure 4: Mathare informal settlement flood simulator
Policy recommendations
To address the socio-economic problems posed by the rapid expansion of informal settlements in Nairobi, the County Government has several opportunities:
- Mainstream geo-visualisation in urban policy and planning. To strengthen evidence-based decision-making, geo-visualisation outputs, such as StoryMaps and 3D simulations, should be institutionalised within urban planning and disaster management frameworks at reduced subscription rates. Decision-makers at the Nairobi County Department of Urban Planning and Development should incorporate geo-visualisation maps and dashboards into routine planning meetings, informal settlements, upgrading assessments, and public consultations. The integration will help bridge the traditional communication gap of static and outdated government records/maps between planners, technical experts, and policymakers by transforming complex databases into visually intuitive formats accessible to non-specialists.
- Develop a centralised geo-visualisation and data integration platform to support continuous monitoring and analysis of the growth of informal settlements. This framework should unify all stages of the data workflow – from field data collection and validation to real-time web-based visualisation – creating a seamless analytical environment for planners, engineers, and decision-makers. By transforming a fragmented approach into a ‘single source of truth’, and thereby decreasing overlaps or conflicts, such a system would reduce redundancy between departments, improve inter-agency coordination, and facilitate evidence-based decision-making. Integrating spatial and non-spatial data would enable near-real-time updates that accurately reflect current realities on the ground.
To achieve this, the County Government should adopt a spatiotemporal analysis approach to monitor expansion and identify growth hotspots; incorporate automated dashboards in their existing GIS labs for near-real-time monitoring of settlement dynamics; and encourage data interoperability by using open standards such as Open Geospatial Consortium (OGC) protocols to promote transparency and re-usability across sectors. These will require hardware (computer and peripherals on which GIS operates), updated GIS software/platforms, and GIS experts. - Enhance data accessibility and technological capacity. The County Government, in collaboration with national agencies such as the Ministry of Lands, Housing and Urban Development and the Kenya Space Agency, should invest in: regular acquisition of Very High Resolution (VHR) imagery and drone mapping capabilities; development of a National Urban Data Infrastructure (NUDI) to standardise datasets for all urban centres; capacity-building programmmes for urban planners, GIS analysts, and local community data collectors; and partnerships with universities and research institutions to foster data-sharing frameworks and innovation hubs focused on spatial intelligence.
- Strengthen community participation and ownership for effective informal settlements upgrading and spatial planning. Community leaders and local organisations play a critical role in data validation, ground-truthing, and advocacy. Therefore, the Department of Urban Planning and Development should institutionalise Participatory GIS (PGIS) practices by training community youth and leaders in basic GIS and mapping skills, integrating community-generated data into official county databases, and establishing feedback mechanisms through community insights that can inform urban policies, infrastructure priorities, and early warning systems. This participatory approach will enhance data legitimacy, foster social accountability, and promote inclusive urban governance.
References
Abbott, J. (2002). An analysis of informal settlement upgrading and critique of existing methodological approaches. Habitat International, 26(3), 303–315. https://doi.org/10.1016/S0197-3975(01)00049-2
African Union. (2015). Agenda 2063: The Africa we want. https://au.int/en/agenda2063/overview
Arimah, B. C. (2010). The face of urban poverty: Explaining the prevalence of slums in developing countries. In Urbanization and Growth (pp. 143–164). Oxford University Press. https://doi.org/10.1093/acprof:oso/9780199590148.003.0008
Bagheri, M. (2012). The challenge of slums: Socio-economic disparities. International Journal of Social Science and Humanity, 2(5), 410–414. https://www.ijssh.net/papers/136-W10044.pdf
Durand-Lasserve, A., & Clerc, V. (1996). Regularization and integration of irregular settlements: Lessons from experience (Urban Management and Land Working Paper No. 6). UNDP/UNCHS(Habitat)/World Bank. https://shs.hal.science/halshs-01186713/document
Huchzermeyer, M. (2008). Slum upgrading in Nairobi within the housing and basic services market: A housing rights concern. Journal of Asian and African Studies, 43(1), 19–39. https://doi.org/10.1177/0021909607085586
Ikejiofor, U. (2006). Equity in informal land delivery: Insights from Enugu, Nigeria. Land Use Policy, 23(4), 448–459. https://doi.org/10.1016/j.landusepol.2005.02.005
Macoloo, G. C., & Owusu, A. (2010). An enumeration and mapping of informal settlements in Kisumu, Kenya, implemented by their inhabitants. Environment and Urbanization, 22(1), 219–231. https://doi.org/10.1177/0956247809362642
Mayo, S. K., & Gross, D. J. (1987). Sites and services—and subsidies: The economics of low-cost housing in developing countries (Water Supply and Urban Development Department Discussion Paper No. UDD 83). World Bank. http://documents.worldbank.org/curated/en/995901468183259646
Mbathi, M. M. (2015). Integrating geo-information tools in informal settlement upgrading processes in Nairobi, Kenya [Doctoral dissertation, University of Twente]. CORE. https://core.ac.uk/download/pdf/40007786.pdf
Ministry of Lands, Public Works, Housing and Urban Development. (2023). National Slum Upgrading and Prevention Strategy 2023-2033. Government of Kenya. https://housingandurban.go.ke/wp-content/uploads/2024/12/National-Slum-Upgrading-and-Prevention-Strategy-2024-2034.pdf
Mkoli, R. M. (2020). Investigating the occurrence of slum gentrification: A case study of Kibera slum upgrading project, Kenya [Master’s thesis, University of Twente]. University of Twente Essay Repository. https://essay.utwente.nl/fileshare/file/85191/85191_Mkoli.pdf
Muraguri, L. (2011). Kenyan government initiatives in slum upgrading. Les Cahiers d’Afrique de l’Est / The East African Review, (44), 119–127. https://doi.org/10.4000/eastafrica.534
Muraya, P. W. (2006). Failed top-down policies in housing: The cases of Nairobi and Santo Domingo. Cities, 23(2), 121–128. https://doi.org/10.1016/j.cities.2005.08.002
Musyoka, W. (2006). Law of succession. LawAfrica.
Otiso, K. M. (2003). State, voluntary and private sector partnerships for slum upgrading and basic service delivery in Nairobi city, Kenya. Cities, 20(4), 221–229. https://doi.org/10.1016/S0264-2751(03)00035-0
Panek, J., & Sobotová, L. (2015). Community mapping in urban informal settlements: Examples from Nairobi, Kenya. The Electronic Journal of Information Systems in Developing Countries, 68(1), 1–13. https://doi.org/10.1002/j.1681-4835.2015.tb00487.x
Pugh, C. (1994). Housing policy development in developing countries: The World Bank and internationalization, 1972–93. Cities, 11(3), 159–180. https://doi.org/10.1016/0264-2751(94)90057-4
Rittel, H. W., & Webber, M. M. (1973). Dilemmas in a general theory of planning. Policy Sciences, 4(2), 155–169. https://doi.org/10.1007/BF01405730
Siriba, D. N., & Nyandiko, O. N. (2013). The social tenure domain model as a framework for community mapping in informal settlements. ResearchGate. https://www.researchgate.net/publication/275037580
UN-Habitat. (2009). Planning sustainable cities: Global report on human settlements 2009. United Nations Human Settlements Programme.
UN-Habitat. (2018). Tracking progress towards inclusive, safe, resilient and sustainable cities and human settlements: SDG 11 synthesis report - High-Level Political Forum 2018. United Nations Human Settlements Programme.
UN-Habitat. (2021). Informal settlements' vulnerability mapping in Kenya: The case of Nakuru. United Nations Human Settlements Programme. https://unhabitat.org/sites/default/files/2021/08/the_case_of_nakuru_.pdf
United Nations Development Programme. (2005). Human development report 2005: International cooperation at a crossroads: Aid, trade and security in an unequal world. Oxford University Press. http://hdr.undp.org/sites/default/files/reports/266/hdr05_complete.pdf
United Nations Human Settlements Programme. (2003). The challenge of slums: Global report on human settlements 2003. Earthscan. https://unhabitat.org/the-challenge-of-slums-global-report-on-human-settlements-2003
Wamuchiru, E. K. (2014). Social innovation and settlement upgrading in Kenya: The case of Kambi Moto settlement, Nairobi [Master's thesis, KU Leuven]. KU Leuven Faculty of Architecture.
Watkins, J., & Kanyinga, K. (2013). Youth and digital mapping in urban informal settlements: Lessons learned from participatory mapping processes in Mathare in Nairobi, Kenya. ResearchGate. https://www.researchgate.net/publication/259751234
White, L. W., Silberman, L., & Anderson, P. (1948). Nairobi: Master plan for a colonial capital. H.M.S.O.
About the Author

Dr. Mildred M. Ambani Songoro
Dr. Mildred Ambani-Songoro is a Lecturer at Kenyatta University, Kenya, and a Registered and Practising Physical Planner. Dr. Ambani-Songoro was awarded a SMUS-APRI Urban Africa Postdoctoral Research Scholarship in 2025, and as part of the scholarship, undertook a three-month research stay with KLAB, a research and teaching unit at the Institute for Urban & Regional Planning (ISR) based at the Technische Universität (TU Berlin).
The Global Center of Spatial Methods for Urban Sustainability (SMUS) is funded by the German Academic Exchange Service (DAAD) with funds from the German Federal Ministry for Economic Cooperation and Development (BMZ).